. 2011 May 21;56(10):3091-106.
doi: 10.1088/0031-9155/56/10/013. Epub 2011 Apr 20.

Design and performance evaluation of a whole-body Ingenuity TF PET-MRI system

Affiliations

Design and performance evaluation of a whole-body Ingenuity TF PET-MRI system

H Zaidi et al. Phys Med Biol. .

Abstract

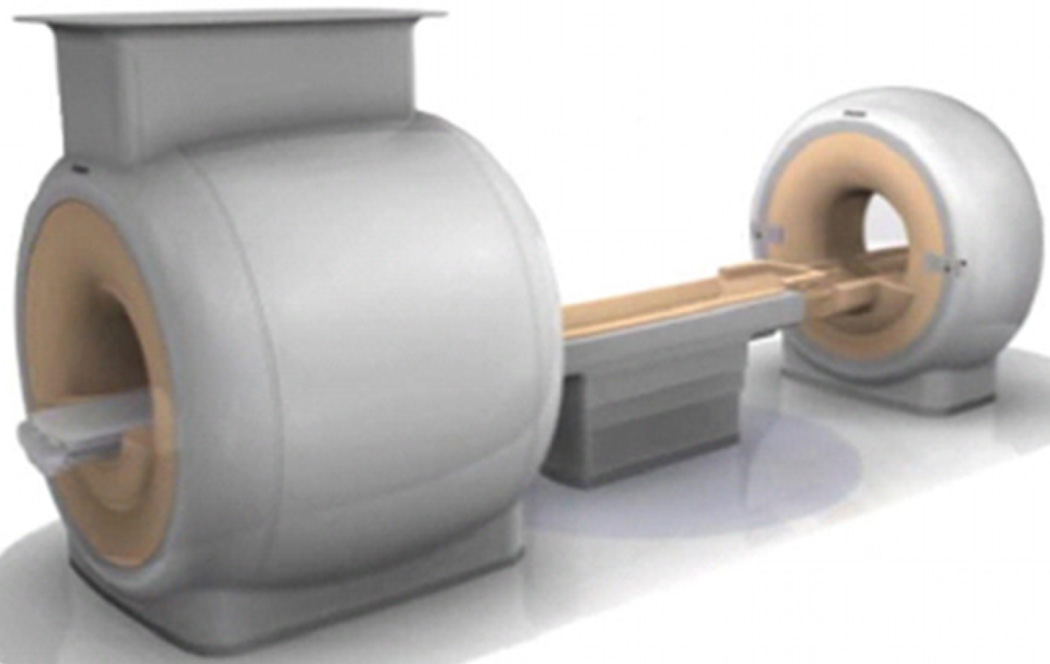
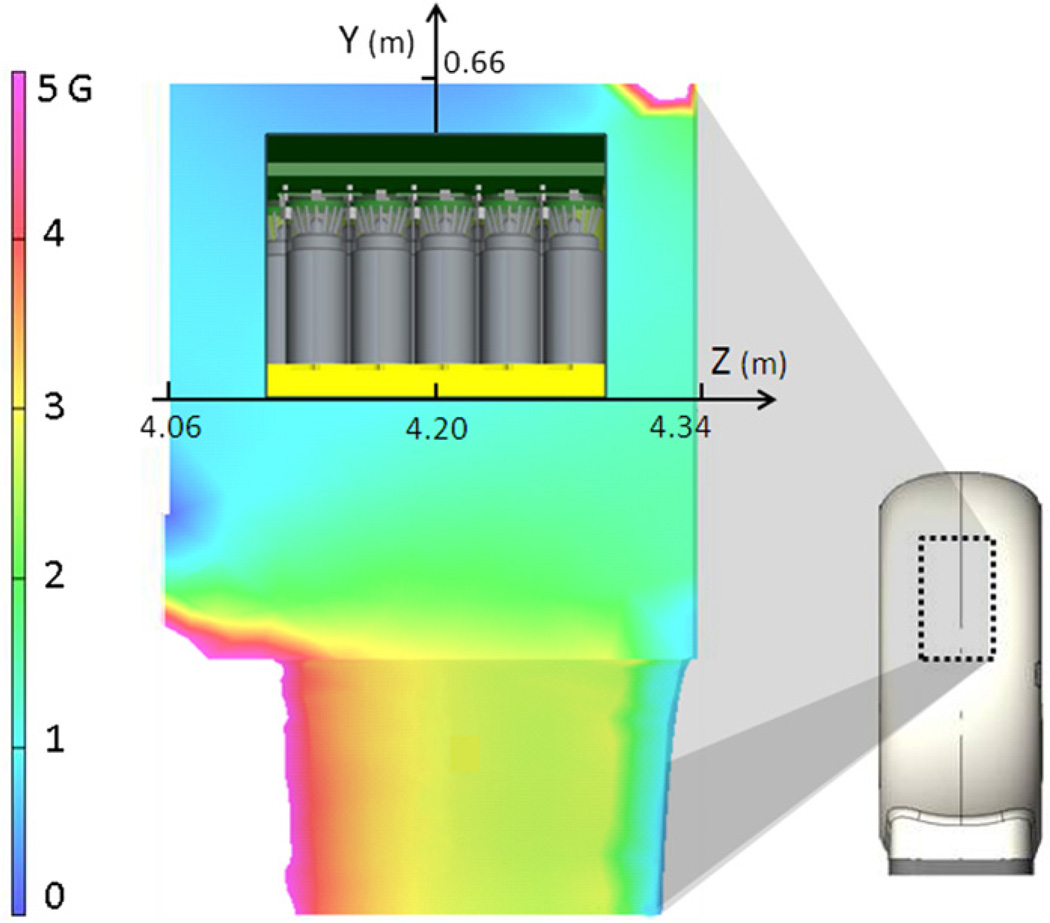
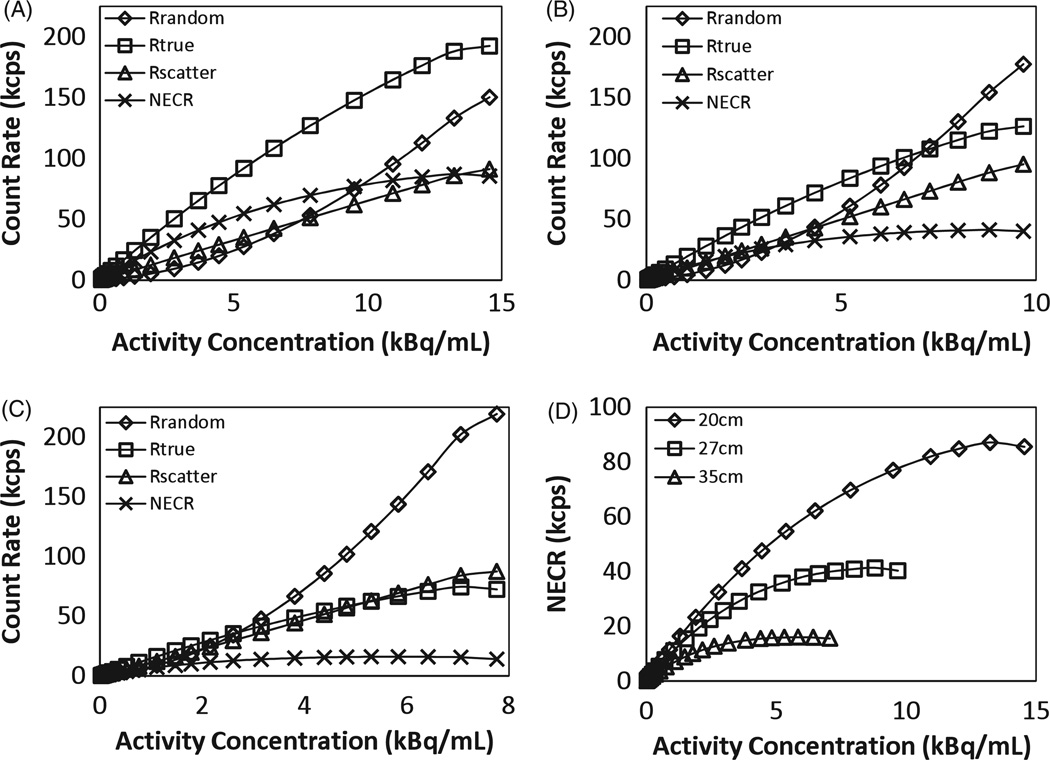
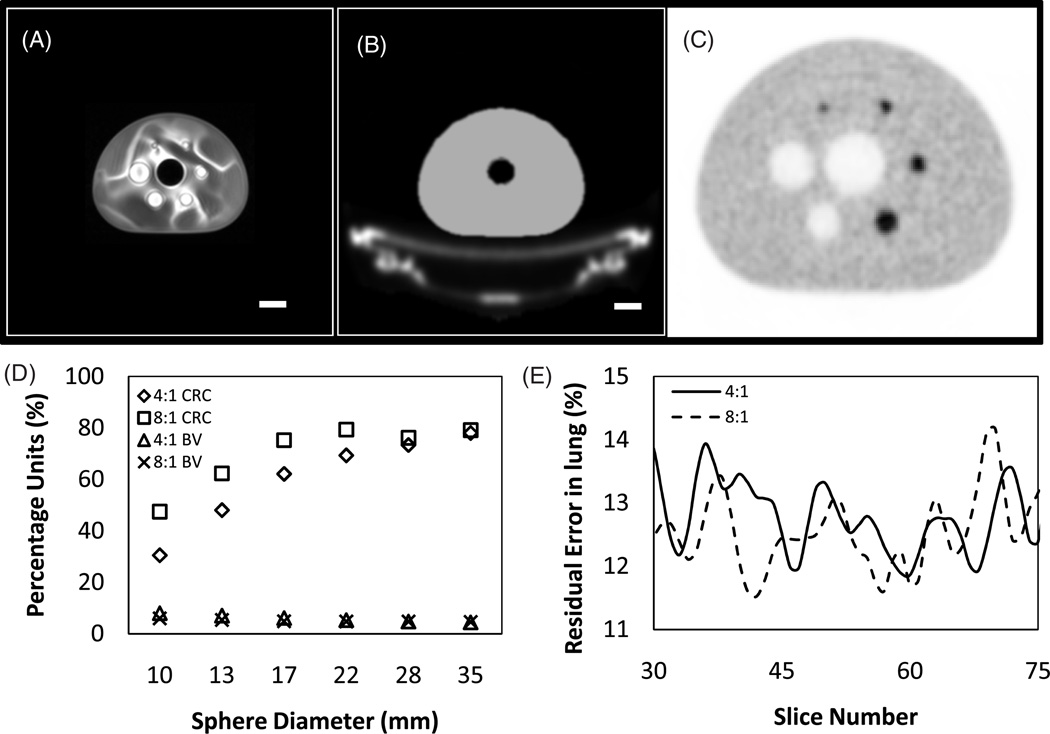
The Ingenuity TF PET-MRI is a newly released whole-body hybrid PET-MR imaging system with a Philips time-of-flight GEMINI TF PET and Achieva 3T X-series MRI system. Compared to PET-CT, modifications to the positron emission tomography (PET) gantry were made to avoid mutual system interference and deliver uncompromising performance which is equivalent to the standalone systems. The PET gantry was redesigned to introduce magnetic shielding for the photomultiplier tubes (PMTs). Stringent electromagnetic noise requirements of the MR system necessitated the removal of PET gantry electronics to be housed in the PET-MR equipment room. We report the standard NEMA measurements for the PET scanner. PET imaging and performance measurements were done at Geneva University Hospital as described in the NEMA Standards NU 2-2007 manual. The scatter fraction (SF) and noise equivalent count rate (NECR) measurements with the NEMA cylinder (20 cm diameter) were repeated for two larger cylinders (27 cm and 35 cm diameter), which better represent average and heavy patients. A NEMA/IEC torso phantom was used for overall assessment of image quality. The transverse and axial resolution near the center was 4.7 mm. Timing and energy resolution of the PET-MR system were measured to be 525 ps and 12%, respectively. The results were comparable to PET-CT systems demonstrating that the effect of design modifications required on the PET system to remove the harmful effect of the magnetic field on the PMTs was negligible. The absolute sensitivity of this scanner was 7.0 cps kBq(-1), whereas SF was 26%. NECR measurements performed with cylinders having three different diameters, and image quality measurements performed with IEC phantom yielded excellent results. The Ingenuity TF PET-MRI represents the first commercial whole-body hybrid PET-MRI system. The performance of the PET subsystem was comparable to the GEMINI TF PET-CT system using phantom and patient studies. It is conceived that advantages of hybrid PET-MRI will become more evident in the near future.


Figures

Figure 1
Figure 1
Illustration of the PET–MRI system. A turntable patient handling system facilitates patient motion between the MRI system on the left and the PET system on the right.
Figure 2
Figure 2
Count density (CD), energy resolution (ER) and timing resolution (TR) were measured on the PET–MRI system after successful completion of the routine daily quality check procedure. To simulate a typical PET–MRI scanning cycle, the PMT voltage was looped through a sequence of 1 h at low voltage (simulating an MRI exam) and 30 min at standard voltage (simulating a PET exam). Measurements were taken after a delay of 1 min (A) and 2 min (B) of switching back to standard voltage in each cycle, which closely represents the delay time between moving a patient between the MRI and PET scanner. ER and TR after all cycles were well within system specifications, namely 117% and 104%p, respectively.
Figure 3
Figure 3
Magnetic flux density inside the PET gantry. Simulation of the fringe magnetic field of the MRI magnet was done to estimate the magnetic flux density in air around the PMTs. The side-view of the PET gantry is shown on the right with the marked area magnified on the left to show the magnetic flux density around one crystal block and PMTs. With the shielding in place, flux around the PMTs was reduced to acceptable levels between 0.76 G and 1.45 G (before introduction of local PMT shielding).
Figure 4
Figure 4
Energy and timing histogram crystal maps. Measurements with a point source were done to calculate per-crystal energy (top row) and timing histograms (bottom row) of the PET with the MRI magnet ramped down (column 1), MRI magnet ramped up but with original PET calibrations (column 2), and finally after fresh PET calibrations (column 3). In each panel, 4 representative crystal blocks (out of 28) are shown in the top row (numbered 1–4), with diametrically opposite blocks in the bottom row (1′–4′). After PET PMT gains recalibration, the effect of magnetic flux at the PMTs was removed and the crystal energy centroids were brought within a tight range (panel C). Data in figures A–C show energy centroids, which are represented as a percentage of 511 keV. Similar results were obtained from plotting the per-crystal timing resolution histograms of the PET scanner where recalibration of the PET after MRI magnet ramp-up resulted in recovery of timing resolution centroids of the system (panel F). Results presented in panels D–F represent the timing resolution (in ps) between a pair of coincidence photons which are recorded in the PET system.
Figure 5
Figure 5
(A) Triangular sensitivity profile as measured with the NEMA NU2-2007 line source. (B) Plot of the measured SF as a function of ELLD for three different cylinder diameters as shown in the legend.
Figure 6
Figure 6
Plot of counting rates as a function of activity concentration for 20 cm (A), 27 cm (B) and 35 cm (C) diameter cylinders. True coincidence rates, random coincidence rates, scatter coincidence rates and NEC rates are plotted. (D) Summary plots for NEC rates as a function of activity concentration in the scanner for the three different cylinders.
Figure 7
Figure 7
(A) Central slice from atMR images of the NEMA IEC body phantom. Imaging parameters were as described in the text. Note that the plastic housing of the phantom and tabletop are not visible in the atMR images. Scale bar = 40 mm. (B) Attenuation map generated from the atMR image. A pre-generated attenuation template of the tabletop was inserted into the image, in addition to the extension of the body of the phantom to account for plastic housing. Scale bar = 40 mm. (C) PET image of the phantom (with 4:1 hot-to-background ratio) using default Philips NEMA acquisition and reconstruction protocol for Ingenuity TF PET systems. The image is magnified by a factor of 2 compared to panels A and B. (D) CRC and BV numbers for the 4:1 and 8:1 hot-to-background ratio IEC phantoms. (E) Residual error in lung insert for the central slices of the phantom calculated for 4:1 and 8:1 ratio phantoms.
Figure 8
Figure 8
Coronal whole-body images for a patient with malignant lesions in the neck region. MRI (left), PET (right) and fused PET–MRI images (center) are shown. The patient was injected with 367 MBq (9.9 mCi) of 18F-FDG 177 min before PET–MRI scan time. PET images were acquired for 150 s per bed position for a total of 11 bed positions.

References

    1. Catana C, Procissi D, Wu Y, Judenhofer MS, Qi J, Pichler BJ, Jacobs RE, Cherry SR. Simultaneous in vivo positron emission tomography and magnetic resonance imaging. Proc. Natl Acad. Sci. USA. 2008;105:3705–3710. - PMC - PubMed
    1. Delso G, Ziegler S. PET/MRI system design. Eur. J. Nuc. Med. Mol. Imaging. 2009;36:86–92. - PubMed
    1. DeMeester G, Morich M, McMahon K, Gagnon D. Magnetic shielding for a pet detector system. US Patent Application. 2009:20090195249.
    1. Gagnon D, Morich M, Blakely D, Nieman K. Hybrid PET/MR imaging systems. US Patent Application. 2008:20080312526.
    1. Hofmann M, Pichler B, Scholkopf B, Beyer T. Towards quantitative PET/MRI: a review of MR-based attenuation correction techniques. Eur. J. Nucl. Med. Mol. Imaging. 2009;36:S93–S104. - PubMed

Publication types

MeSH terms