. 2011 Jun 27;91(12):1333-9.
doi: 10.1097/TP.0b013e31821c1e8b.

Tacrolimus and sirolimus induce reproductive abnormalities in female rats

Affiliations

Tacrolimus and sirolimus induce reproductive abnormalities in female rats

Vijay Shivaswamy et al. Transplantation. .

Abstract

Background: Immunosuppression medications contribute to posttransplant diabetes mellitus in patients and can cause insulin resistance in male rats. Tacrolimus (TAC)-sirolimus (SIR) immunosuppression is also associated with appearance of ovarian cysts in transplant patients. Because insulin resistance is observed in patients with polycystic ovary syndrome, we hypothesized that TAC or SIR may induce reproductive abnormalities.

Methods: We monitored estrus cycles of adult female rats treated daily with TAC, SIR, and combination of TAC-SIR, or diluent (control) for 4 weeks. Animals were then challenged with oral glucose to determine their glucose and insulin responses, killed, and their blood and tissues, including ovaries and uteri harvested.

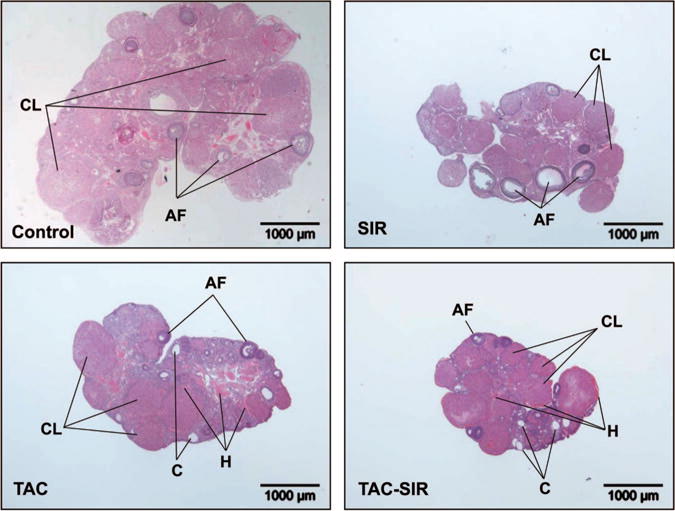
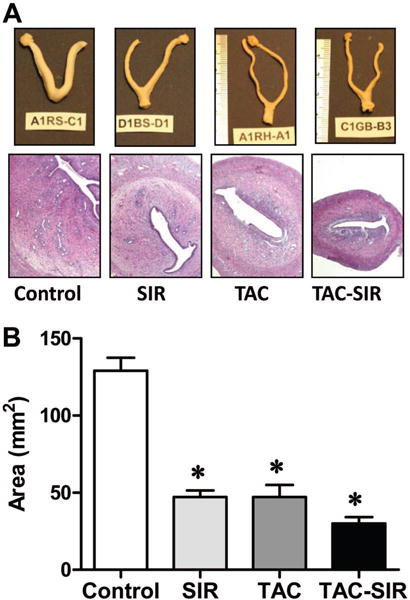
Results: TAC and TAC-SIR treatments increased mean random glucose concentrations (P<0.05). TAC, SIR, and TAC-SIR treatments also increased the glucose response to oral glucose challenge (P<0.05). The insulin response to glucose was significantly higher in rats treated with SIR compared with TAC (P<0.05). TAC, SIR and TAC-SIR treatments reduced number of estrus cycles (P<0.05). The ovaries were smaller after SIR and TAC-SIR treatment compared with controls. The TAC and TAC-SIR treatment groups had fewer preovulatory follicles. Corpora lutea were present in all groups. Ovarian aromatase expression was reduced in the SIR and TAC-SIR treatment groups. A significant (P<0.05) reduction in uterine size was observed in all treatment groups when compared with controls.

Conclusion: In a model of immunosuppressant-induced hyperglycemia, both TAC and SIR induced reproductive abnormalities in adult female rats, likely through different mechanisms.


Conflict of interest statement

The authors declare no conflict of interest.

Figures

FIGURE 1
FIGURE 1
Effects of sirolimus, tacrolimus, and the combination of tacrolimus and sirolimus on estrus cycle patterns. Adult female rats were treated with sirolimus (SIR), tacrolimus (TAC), tacrolimus + sirolimus (TAC-SIR), or diluent (control), administered as daily subcutaneous injections as described in the Methods. (A) Estrus cycle staging of individual animals was determined by daily vaginal swabs. D, diestrus; E, estrus; P, proestrus. (B) The average number of estrus cycles was determined in each group and results are presented as means ± standard error of the mean (SEM). (C) The average estrus cycle length was determined and results are presented as mean ± SEM. *P less than 0.05 versus control.
FIGURE 2
FIGURE 2
Effects of sirolimus, tacrolimus, and the combination of tacrolimus and sirolimus on ovarian morphology. Adult female rats were treated with sirolimus (SIR), tacrolimus (TAC), tacrolimus + sirolimus (TAC-SIR), or diluent (Control), administered as daily subcutaneous injections as described in the Materials and Methods. Ovaries were harvested and fixed in 10% formalin for histology and counterstained with hematoxylin-eosin. AF, antral follicles; CL, corpus luteum; C, cyst; H, hemorrhagic tissue.
FIGURE 3
FIGURE 3
Effects of sirolimus on ovarian protein expression. Adult female rats were treated with sirolimus (SIR) or diluent (control). Ovaries were harvested and processed for western blot analysis as described in the Methods. (A) Western blot analysis was performed using antibodies against the phospho-specific p70 S6K (Thr389) and total p70S6K, ribosomal protein S6 and phospho-specific ribosomal protein S6 (Ser235/236), 3β-hydroxysteroid dehydrogenase (3β-HSD), aromatase, and β-actin as aloading control. (B–E) Quantitative analysis of the immunoblot described in (A). Results are expressed as a ratio of phospho-specific protein to total p70S6K (B) or S6 (C) or as a ratio of aromatase (D) or 3β-HSD (E) to β-actin in each ovarian sample. Shown are mean ± standard error of the mean from five animals. *P less than 0.05 versus control.
FIGURE 4
FIGURE 4
Effects of tacrolimus and tacrolimus + sirolimus on ovarian protein expression. Adult female rats were treated with tacrolimus (TAC), tacrolimus plus sirolimus (TAC-SIR), or diluent (control). Ovaries were harvested and processed for western blot analysis as described in the Materials and Methods. (A) Western blot analysis was performed using antibodies against the phospho-specific p70 S6K (Thr389) and total p70S6K, ribosomal protein S6 and phospho-specific ribosomal protein S6 (Ser235/236), 3β-hydroxysteroid dehydrogenase (3β-HSD), aromatase, and β-actin as a loading control. (B–E) Quantitative analysis of the immunoblot described in (A). Results are expressed as a ratio of phospho-specific protein to total p70S6K (B) or S6 (C) or as a ratio of aromatase (D) or 3β-HSD (E) to β-actin in each ovarian sample. Shown are means ± standard error of the mean; *P less than 0.05 versus control.
FIGURE 5
FIGURE 5
Effects of sirolimus, tacrolimus, and the combination of tacrolimus and sirolimus on uterine morphology. Adult female rats were treated with sirolimus (SIR), tacrolimus (TAC), tacrolimus + sirolimus (TAC-SIR) or diluent (control), administered as daily subcutaneous injections as described in the Methods. (A) Uteri were harvested and fixed in 10% formalin. A segment of the mid portion of each uterine horn was processed for histology and counterstained with hematoxylin-eosin. (B) The cross sectional area was determined and results are shown as mean ± standard error of the mean; *P less than 0.05 versus control.

Similar articles

Cited by

References

    1. Davidson J, Wilkinson A, Dantal J, et al. New-onset diabetes after transplantation: 2003 International consensus guidelines. Transplantation; Proceedings of an international expert panel meeting; Barcelona, Spain. 19 February 2003; 2003. p. SS3. - PubMed
    1. Hjelmesaeth J, Hartmann A, Leivestad T, et al. The impact of early-diagnosed new-onset post-transplantation diabetes mellitus on survival and major cardiac events. Kidney Int. 2006;69:588. - PubMed
    1. Sato T, Inagaki A, Uchida K, et al. Diabetes mellitus after transplant: Relationship to pretransplant glucose metabolism and tacrolimus or cyclosporine A-based therapy. Transplantation. 2003;76:1320. - PubMed
    1. Sulanc E, Lane JT, Puumala SE, et al. New-onset diabetes after kidney transplantation: An application of 2003 International Guidelines. Transplantation. 2005;80:945. - PubMed
    1. Penfornis A, Kury-Paulin S. Immunosuppressive drug-induced diabetes. Diabetes Metab. 2006;32(5 pt 2):539. - PubMed

Publication types