

Predicting individual risk of neutropenic complications in patients receiving cancer chemotherapy
- PMID: 21509769
- PMCID: PMC3640637
- DOI: 10.1002/cncr.25691
Predicting individual risk of neutropenic complications in patients receiving cancer chemotherapy
Abstract
Background: A prospective cohort study was undertaken to develop and validate a risk model for neutropenic complications in cancer patients receiving chemotherapy.
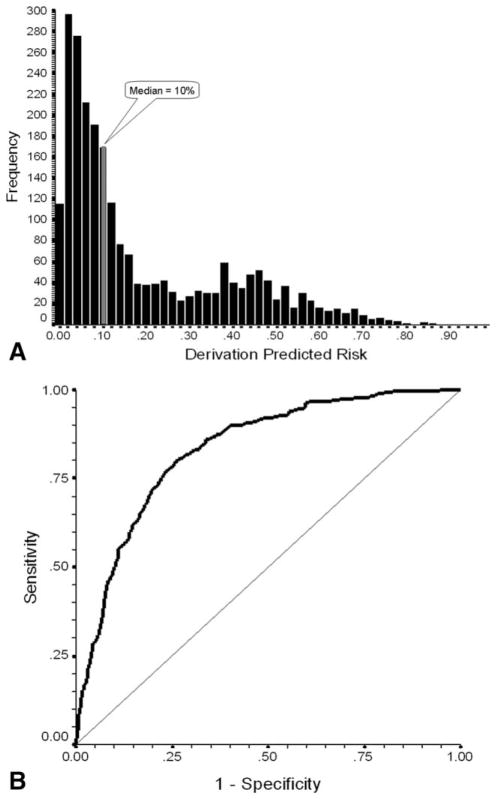
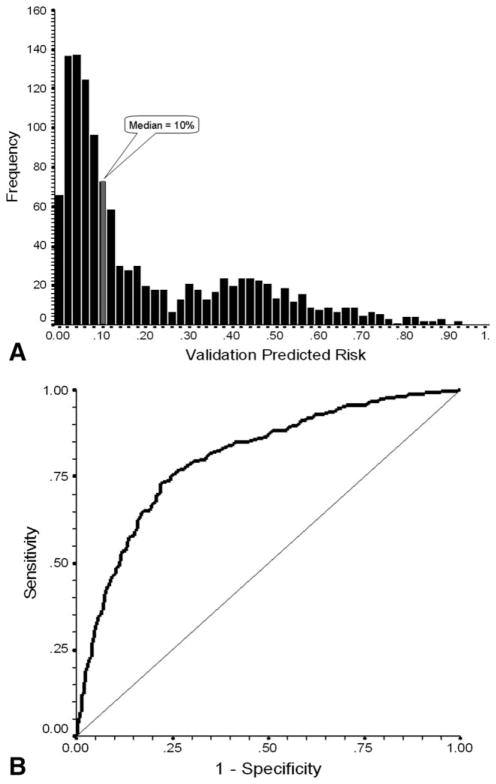
Methods: The study population consisted of 3760 patients with common solid tumors or malignant lymphoma who were beginning a new chemotherapy regimen at 115 practice sites throughout the United States. A regression model for neutropenic complications was developed and then validated by using a random split-sample selection process.
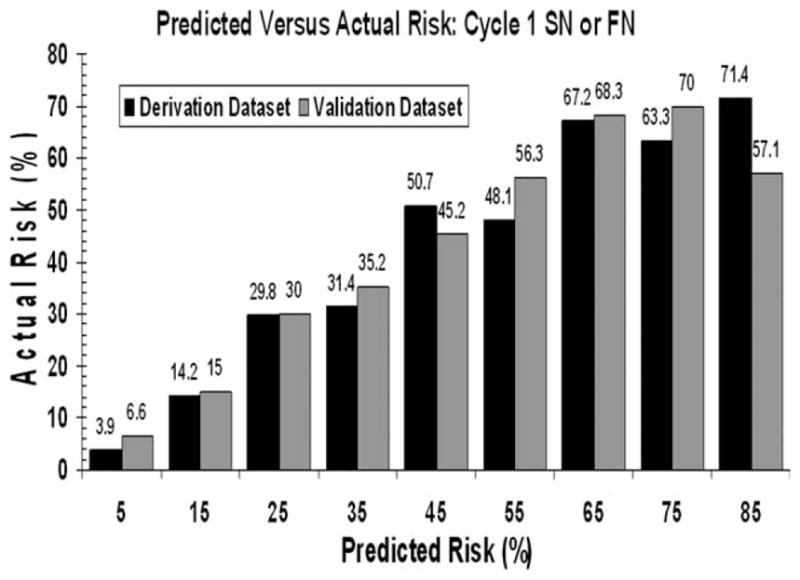
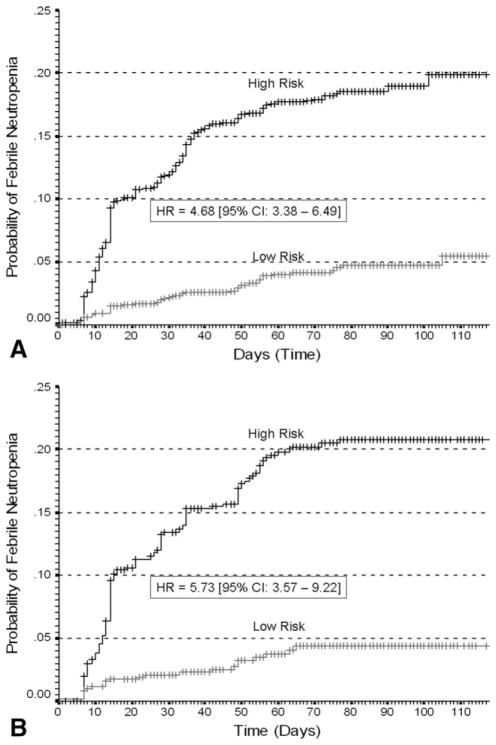
Results: No significant differences in the derivation and validation populations were observed. The risk of neutropenic complications was greatest in cycle 1 with no significant difference in predicted risk between the 2 cohorts in univariate analysis. After adjustment for cancer type and age, major independent risk factors in multivariate analysis included: prior chemotherapy, abnormal hepatic and renal function, low white blood count, chemotherapy and planned delivery ≥85%. At a predicted risk cutpoint of 10%, model test performance included: sensitivity 90%, specificity 59%, and predictive value positive and negative of 34% and 96%, respectively. Further analysis confirmed model discrimination for risk of febrile neutropenia over multiple chemotherapy cycles.
Conclusions: A risk model for neutropenic complications was developed and validated in a large prospective cohort of patients who were beginning cancer chemotherapy that may guide the effective and cost-effective use of available supportive care.
Copyright © 2010 American Cancer Society.
Conflict of interest statement
CONFLICT OF INTEREST DISCLOSURES
Gary Lyman is supported by grants from the National Cancer Institute (RC2CA148041-01) and the National Heart, Lung and Blood Institute (1R01HL095109-01). This study was supported, in part, by an unrestricted research grant to Duke University from Amgen. The funding agency was not involved in the study design, data collection and analysis or in the preparation and approval of this report.
Figures
References
-
- Kuderer NM, Dale DC, Crawford J, et al. Mortality, morbidity, and cost associated with febrile neutropenia in adult cancer patients. Cancer. 2006;106:2258–2266. - PubMed
-
- Lyman GH, Dale DC, Crawford J. Incidence and predictors of low dose-intensity in adjuvant breast cancer chemotherapy: a nationwide study of community practices. J Clin Oncol. 2003;21:4524–4531. - PubMed
-
- Lyman GH, Dale DC, Friedberg J, et al. Incidence and predictors of low chemotherapy dose-intensity in aggressive non-Hodgkin’s lymphoma: a nationwide study. J Clin Oncol. 2004;22:4302–4311. - PubMed
-
- Lyman GH. Impact of chemotherapy dose intensity on cancer patient outcomes. J Natl Compr Canc Netw. 2009;7:99–108. - PubMed
-
- Shayne M, Culakova E, Wolff D, et al. Dose intensity and hematologic toxicity in older breast cancer patients receiving systemic chemotherapy. Cancer. 2009;115:5319–5328. - PubMed
Publication types
MeSH terms
Substances
Grants and funding
LinkOut - more resources
Full Text Sources
