. 2011 Jun 3;10(6):2873-81.
doi: 10.1021/pr200200y. Epub 2011 May 11.

NMR-based metabolomic analysis of the molecular pathogenesis of therapy-related myelodysplasia/acute myeloid leukemia

Affiliations

NMR-based metabolomic analysis of the molecular pathogenesis of therapy-related myelodysplasia/acute myeloid leukemia

Kristin E Cano et al. J Proteome Res. .

Abstract

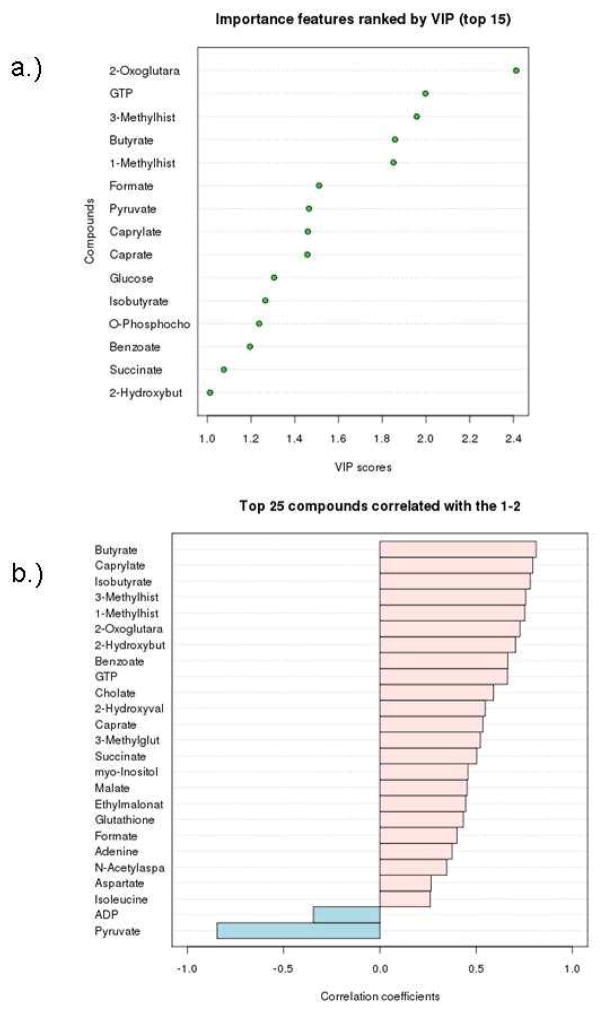
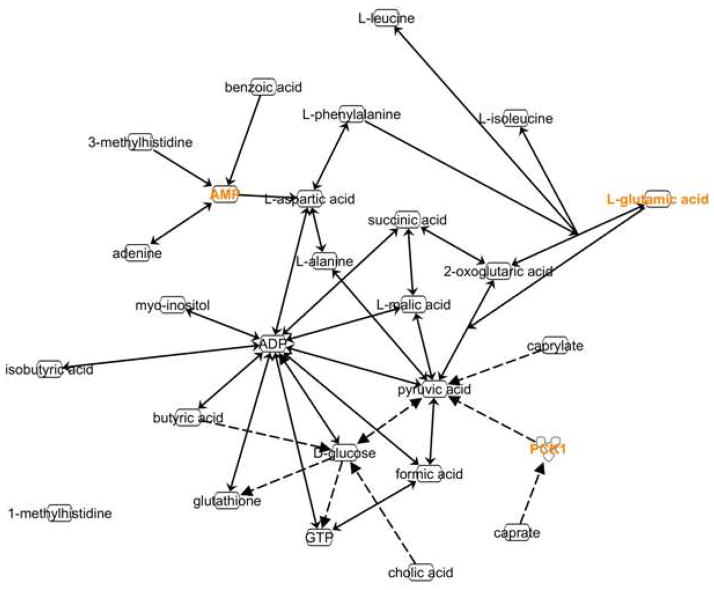
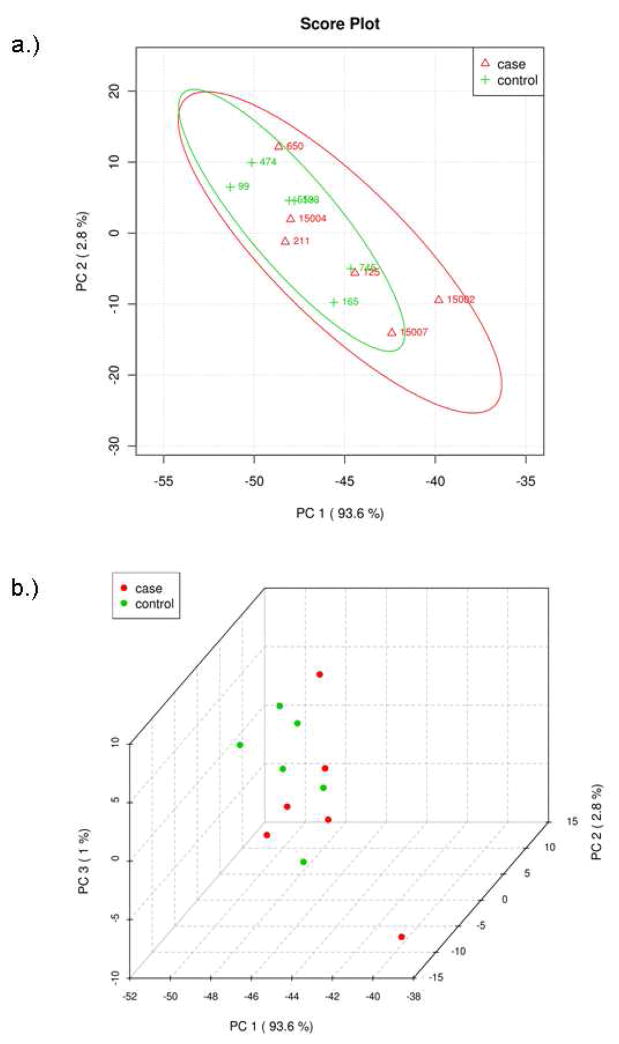
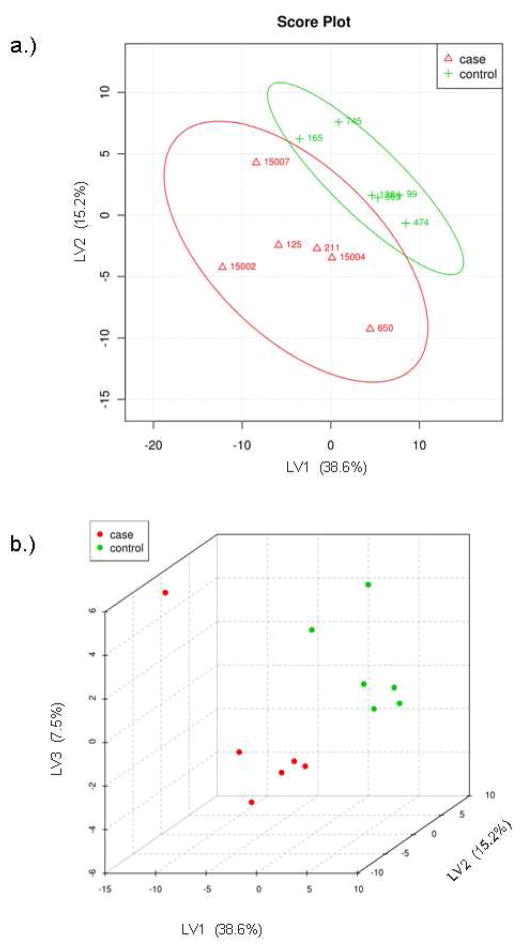
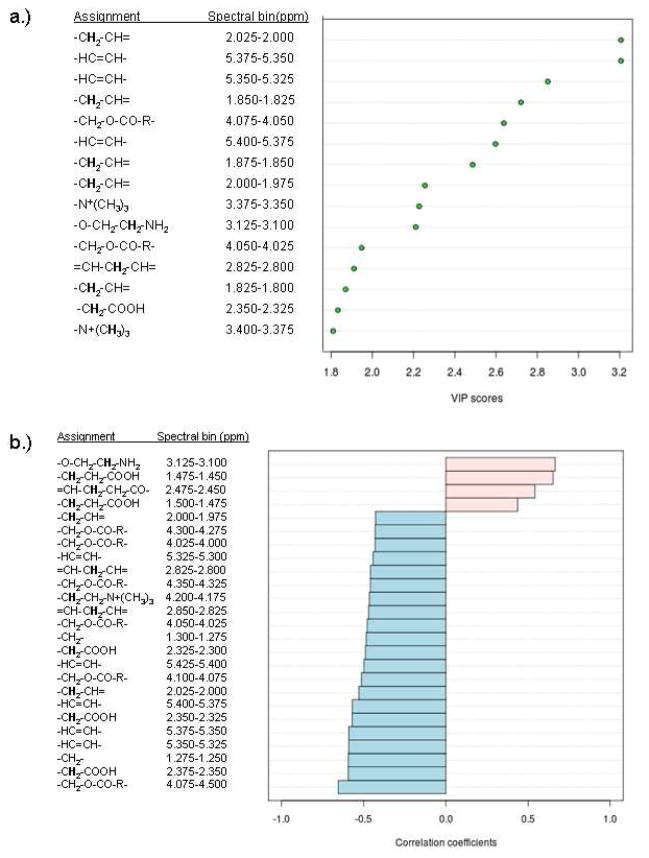
Hematopoietic stem cell transplantation is the oldest and most successful form of stem cell therapy. High dose therapy (HDT) followed by hematopoietic stem cell transplantation allows physicians to administer increased amounts of chemotherapy and/or radiation while minimizing negative side effects such as damage to blood-producing bone marrow cells. Although HDT is successful in treating a wide range of cancers, it leads to lethal therapy-related myelodysplasia syndrome or acute myeloid leukemia (t-MDS/AML) in 5--10% of patients undergoing autologous hematopoietic cell transplantation for Hodgkin lymphoma and non-Hodgkin lymphoma. In this study, we carried out metabolomic analysis of peripheral blood stem cell samples collected in a cohort of patients before hematopoietic cell transplantation to gain insights into the molecular and cellular pathogenesis of t-MDS. Nonparametric tests and multivariate analyses were used to compare the metabolite concentrations in samples from patients that developed t-MDS within 5 years of transplantation and the patients that did not. The results suggest that the development of t-MDS is associated with dysfunctions in cellular metabolic pathways. The top canonical pathways suggested by the metabolomic analysis include alanine and aspartate metabolism, glyoxylate and dicarboxylate metabolism, phenylalanine metabolism, citrate acid cycle, and aminoacyl-t-RNA biosynthesis. Dysfunctions in these pathways indicate mitochondrial dysfunction that would result in decreased ability to detoxify reactive oxygen species generated by chemo and radiation therapy, therefore leading to cancer-causing mutations. These observations suggest predisposing factors for the development of t-MDS.


Figures

Figure 1
Figure 1
Proton NMR spectra of the hydrophilic metabolites from PBSC samples. The intensity of the downfield region is increased to facilitate identification of resonances. Spectra in black represent typical results for a control patient, while those in red represent those for a t-MDS patient.
Figure 2
Figure 2
Nonparametric testing of PBSC metabolites. (A) Metabolites significantly altered in PBSC samples from cases (red) compared with controls (blue) are shown (MWU p<0.05; n=6 each). (B) Metabolites with possible alterations in cases (red) compared to controls (blue) (MWU 0.05 < p <0.15; n=6 each).
Figure 3
Figure 3
Principal components analysis of metabolic profile differences between patient groups. (A) PCA scores of components 1 and 2 of calculated hydrophilic metabolite levels from control PBSC samples (green) and t-MDS patient PBSC (red). (B) PCA scores of components 1, 2, and 3 for the control PBSC (green) and t-MDS/AML PBSC (red). The explained variances are shown in parentheses.
Figure 4
Figure 4
Partial least squares discriminant analysis of metabolite concentrations between patient groups. (A) PLS-DA scores of latent variables 1 and 2 of calculated hydrophilic metabolite levels from control PBSC samples (green) and t-MDS/AML patient samples (red). (B) PLS-DA scores of latent variables 1, 2, and 3 for the control PBSC (green) and t-MDS/AML PBSC (red). The explained variances are shown in parentheses.
Figure 5
Figure 5
(A) Top 15 important features identified by PLS-DA. (B) Top 25 important features selected by correlation analysis with positive correlation coefficients indicate metabolites increased in control PBSC, while negative correlations are associated with increased levels in tMDS/AML cases.
Figure 6
Figure 6
Schematic representation of the interaction between significantly relevant hydrophilic metabolites. Ingenuity Pathway software was used to search connections between selected metabolites. Direct biochemical reactions are indicated by solid arrows; indirect effects are represented by dashed arrows.
Figure 7
Figure 7
Proton NMR of lipophilic fractions from PBSC samples. The intensity of the downfield region is increased to facilitate identification of resonances. Spectra in black represent typical results for a control patient, while those in red present those for a t-MDS/AML patient.
Figure 8
Figure 8
Principal components analysis of lipophilic profile differences between patient groups. (A) PCA scores of components 1 and 2 from spectral binning of control PBSC samples (green) and t-MDS/AML patient PBSC (red) spectra. (B) PCA scores of components 1, 2, and 3 for the control PBSC (green) and t-MDS/AML PBSC (red). The explained variances are shown in parentheses.
Figure 9
Figure 9
Partial least squares discriminant analysis of metabolite concentrations between patient groups. (A) PLS-DA scores of latent variables 1 and 2 of lipophilic spectral bins from control PBSC samples (green) and t-MDS/AML patient samples (red). (B) PLS-DA scores of latent variables 1, 2, and 3 for the control PBSC (green) and t-MDS/AML PBSC (red). The explained variances are shown in parentheses.
Figure 10
Figure 10
(A) Top 15 important spectral bins identified by PLS-DA. (B) Top 25 important spectral bins selected by correlation analysis, with positive correlation coefficients correlating with control PBSC (increased levels compared to cases) and negative correlations indicating correlation with t-MDS/AML cases (increased levels compared to controls.

References

    1. Hauke RJ, Armitage JO. Treatment of non-Hodgkin lymphoma. Current Opinion in Oncology. 2000;12(5):412–418. - PubMed
    1. Bhatia S, Ramsay NK, Steinbuch M, Dusenbery KE, Shapiro RS, Weisdorf DJ, Robison LL, Miller JS, Neglia JP. Malignant neoplasms following bone marrow transplantation. Blood. 1996;87(9):3633–3639. - PubMed
    1. Miller JS, Arthur DC, Litz CE, Neglia JP, Miller WJ, Weisdorf DJ. Myelodysplastic syndrome after autologous bone marrow transplantation: an additional late complication of curative cancer therapy [see comments] Blood. 1994;83(12):3780–3786. - PubMed
    1. Pedersen-Bjergaard J, Andersen MK, Christiansen DH. Therapy-related acute myeloid leukemia and myelodysplasia after high-dose chemotherapy and autologous stem cell transplantation. Blood. 2000;95(11):3273–3279. - PubMed
    1. Stone RM, Neuberg D, Soiffer R, Takvorian T, Whelan M, Rabinowe SN, Aster JC, Leavitt P, Mauch P, Freedman AS. Myelodysplastic syndrome as a late complication following autologous bone marrow transplantation for non-Hodgkin’s lymphoma. J Clin Oncol. 1994;12(12):2535–2542. - PubMed

Publication types

MeSH terms