. 2011 Apr 21:11:110.
doi: 10.1186/1471-2148-11-110.

Algal MIPs, high diversity and conserved motifs

Affiliations

Algal MIPs, high diversity and conserved motifs

Hanna I Anderberg et al. BMC Evol Biol. .

Abstract

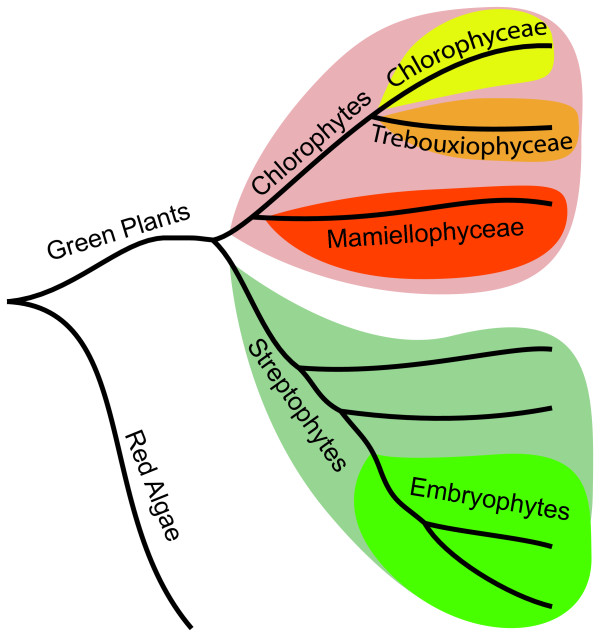
Background: Major intrinsic proteins (MIPs) also named aquaporins form channels facilitating the passive transport of water and other small polar molecules across membranes. MIPs are particularly abundant and diverse in terrestrial plants but little is known about their evolutionary history. In an attempt to investigate the origin of the plant MIP subfamilies, genomes of chlorophyte algae, the sister group of charophyte algae and land plants, were searched for MIP encoding genes.

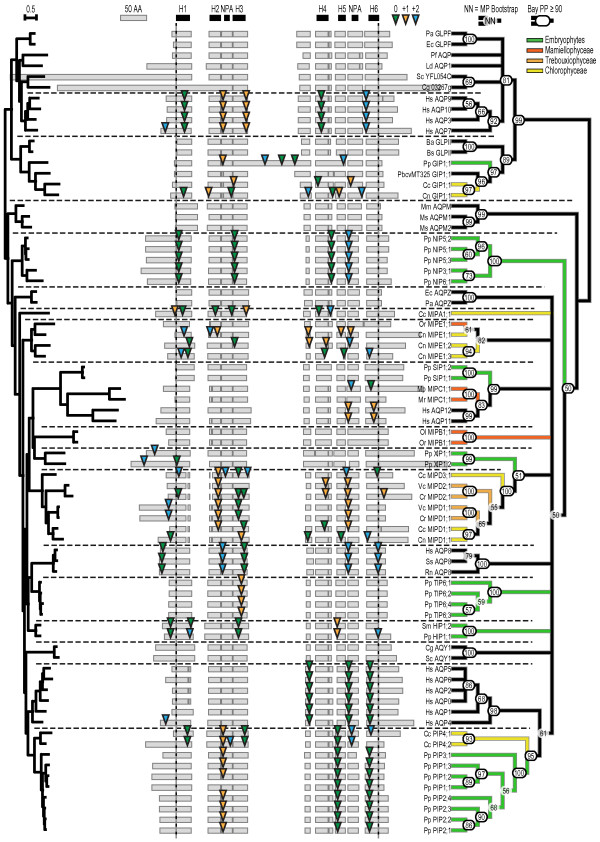
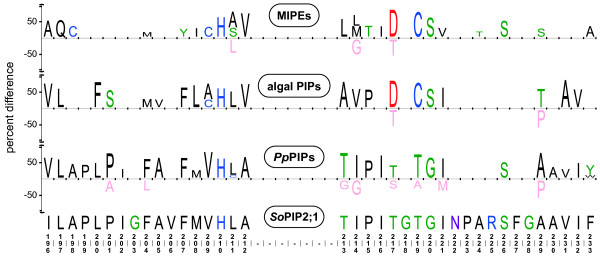
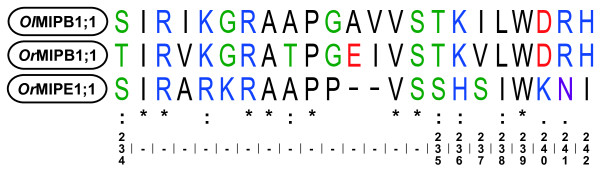
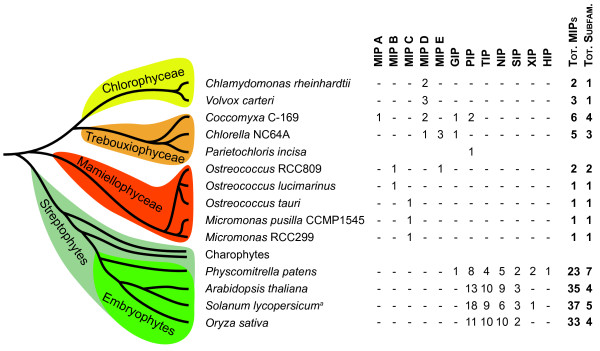
Results: A total of 22 MIPs were identified in the nine analysed genomes and phylogenetic analyses classified them into seven subfamilies. Two of these, Plasma membrane Intrinsic Proteins (PIPs) and GlpF-like Intrinsic Proteins (GIPs), are also present in land plants and divergence dating support a common origin of these algal and land plant MIPs, predating the evolution of terrestrial plants. The subfamilies unique to algae were named MIPA to MIPE to facilitate the use of a common nomenclature for plant MIPs reflecting phylogenetically stable groups. All of the investigated genomes contained at least one MIP gene but only a few species encoded MIPs belonging to more than one subfamily.

Conclusions: Our results suggest that at least two of the seven subfamilies found in land plants were present already in an algal ancestor. The total variation of MIPs and the number of different subfamilies in chlorophyte algae is likely to be even higher than that found in land plants. Our analyses indicate that genetic exchanges between several of the algal subfamilies have occurred. The PIP1 and PIP2 groups and the Ca2+ gating appear to be specific to land plants whereas the pH gating is a more ancient characteristic shared by all PIPs. Further studies are needed to discern the function of the algal specific subfamilies MIPA-E and to fully understand the evolutionary relationship of algal and terrestrial plant MIPs.


Figures

Figure 1
Figure 1
Schematic phylogeny of green plants. The chlorophytes (pink) and the streptophytes (light green) constitute the two phyla of green plants. The chlorophytes are further divided into a number of classes including chlorophyceae (yellow), trebouxiophyceae (orange) and mamiellophyceae (red) whereof mamiellophyceae is the basal clade. Terrestrial plants (embryophytes; green) are part of the streptophyte phylum. The position of red algae is indicated to root the schematic tree.
Figure 2
Figure 2
Structural alignment, intron positions and phylogeny. The gray boxes in the middle of the picture show the actual amino acid sequence alignment of the proteins included in the analysis whereas the black boxes at the top indicate the position of the structurally conserved elements, transmembrane helices (H1-H6) and the NPA-boxes. The central portion of the alignment used in phylogenetic analyses is delimited by the vertical dotted lines, excluding the N- and C-terminal regions. The coloured arrows indicate intron positions in the corresponding coding sequence, where the colours represent the relative position within the codon. The tree to the left is the Maximum Likelihood tree where the length of the branches is representative of sequence divergence. To the right a consensus tree based on the results from the maximum likelihood analysis is depicted, showing the stability of the clustering of sequences. The bootstrap support in percent is indicated at each node (nodes with bootstrap support lower than 50% are collapsed) and for nodes with a Bayesian posterior probability above 90% this number is also circled. Horizontal dotted lines separate clearly distinguishable clusters. The coloured branches in the consensus tree highlight from which phyla the plant MIPs were derived, see also Figures 1 and 7.
Figure 3
Figure 3
Sequence similarities between algal PIPs and MIPEs in loop E. Figure showing iceLogos of part of Loop E for MIPEs, algal PIPs and P. patens PIPs. For each of the three groups compared, the iceLogo shows the position specific over- and under representations of amino acids compared to an alignment of all MIPs included in the phylogenetic analysis. Only amino acids significantly different in the test- and reference set (P < 0.05) are shown and the size of the character reflect the difference in frequency (positive values are overrepresented whereas negative values are underrepresented in the test set). At the bottom the amino acid sequence and numbering of SoPIP2;1 is shown to ease orientation.
Figure 4
Figure 4
Comparisons of the extended loop E of MIPBs and OrMIPE1;1. The figure shows a sequence alignment of OlMIPB1;1, OrMIPB1;1 and OrMIPE1;1. The numbering at the bottom is referring to amino acid positions in the SoPIP2;1 sequence and the symbols over these are representing identity (*) or two degrees of similarity (: and .) of the aligned sequences.
Figure 5
Figure 5
Alternative interaction network of MIPBs and MIPEs. MIPBs and MIPEs have unusual substitutions in helix 3 and loop B suggesting an alternative network of interactions in the packing core next to the pore at the cytoplasmic side. SoPIP2;1 is shown in green and a model of OlMIPB1;1 is superimposed in brown. The side chains at the substituted positions are drawn as sticks and their potential interactions are indicated by dashed lines with distances in Å.
Figure 6
Figure 6
Structural alignment of internal symmetry. All MIPs consist of 6 transmembrane helices and two half helices, HB and HE, that together form a seventh transmembrane domain, as illustrated by the cartoon representation of the AQP4 structure to the left (PDB ID: 3GD8). Internal sequence similarities and the two-fold quasi symmetry suggest that MIPs have evolved through an internal duplication. Highlighted in green are the structural elements H3 and HB, whereas corresponding parts in the second repeat are coloured in magenta. The close up to the right depicts a structural alignment of these elements showing asparagine and proline of the NPA motif at the beginning of HB and HE as sticks. The side chain of the conserved glutamine in H3 is directed towards the nitrogen of the NPA proline in HB. In almost all MIPs the corresponding interaction in the second half of the protein is provided by a backbone oxygen in H6. This is possible due to a conserved proline hindering an α-helical H-bond within H6. Interestingly, the proline in H6 is not conserved in MIPDs which in general have glutamine or glutamate at this position, suggesting that these MIPs are more symmetrical. This structure might in fact resemble the ancestral form created by the internal duplication.
Figure 7
Figure 7
Overview of identified MIP subfamilies in green plants. A schematic tree showing the evolutionary relationship between green plant lineages is combined with a table summarizing the distribution of plant MIP subfamilies. MIPA-E constitutes novel subfamilies identified in this study. The PIP and the GIP subfamilies appear to have evolved before the split of the chlorophyte and the streptophyte lineages. For all plants except S. lycopersicum and P. incise the number of MIPs is derived from annotations of whole genomes [9,55,56]. a) The occurrence of MIPs in S. lycopersicum is based on an extensive analysis of ESTs [57].

References

    1. Preston GM, Carroll TP, Guggino WB, Agre P. Appearance of water channels in Xenopus oocytes expressing red cell CHIP28 protein. Science. 1992;256(5055):385–387. doi: 10.1126/science.256.5055.385. - DOI - PubMed
    1. Echevarria M, Windhager EE, Tate SS, Frindt G. Cloning and expression of AQP3, a water channel from the medullary collecting duct of rat kidney. Proc Natl Acad Sci USA. 1994;91(23):10997–11001. doi: 10.1073/pnas.91.23.10997. - DOI - PMC - PubMed
    1. Ishibashi K, Kuwahara M, Gu Y, Kageyama Y, Tohsaka A, Suzuki F, Marumo F, Sasaki S. Cloning and functional expression of a new water channel abundantly expressed in the testis permeable to water, glycerol, and urea. J Biol Chem. 1997;272(33):20782–20786. doi: 10.1074/jbc.272.33.20782. - DOI - PubMed
    1. Ishibashi K, Sasaki S, Fushimi K, Uchida S, Kuwahara M, Saito H, Furukawa T, Nakajima K, Yamaguchi Y, Gojobori T. et al.Molecular cloning and expression of a member of the aquaporin family with permeability to glycerol and urea in addition to water expressed at the basolateral membrane of kidney collecting duct cells. Proc Natl Acad Sci USA. 1994;91(14):6269–6273. doi: 10.1073/pnas.91.14.6269. - DOI - PMC - PubMed
    1. Ma T, Frigeri A, Hasegawa H, Verkman AS. Cloning of a water channel homolog expressed in brain meningeal cells and kidney collecting duct that functions as a stilbene-sensitive glycerol transporter. J Biol Chem. 1994;269(34):21845–21849. - PubMed

Publication types

LinkOut - more resources