

Comparative Study
doi: 10.1016/j.jacc.2010.09.083.
Incidence of cardiovascular risk factors in an Indian urban cohort results from the New Delhi birth cohort
Affiliations
- PMID: 21511113
- PMCID: PMC3408699
- DOI: 10.1016/j.jacc.2010.09.083
Item in Clipboard
Comparative Study
Incidence of cardiovascular risk factors in an Indian urban cohort results from the New Delhi birth cohort
J Am Coll Cardiol.
.
No abstract available
Figures
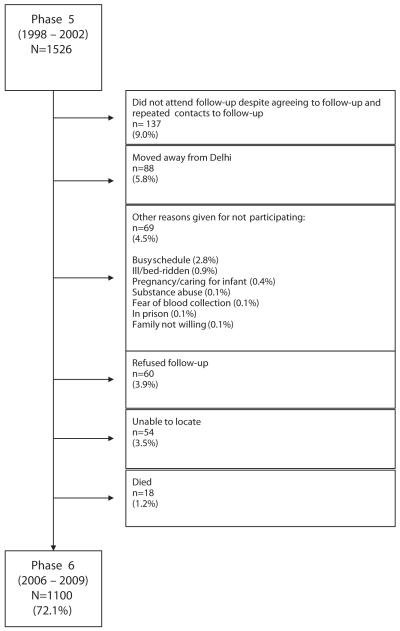
Flow diagram of reasons for loss to follow-up between phases 5 and 6.
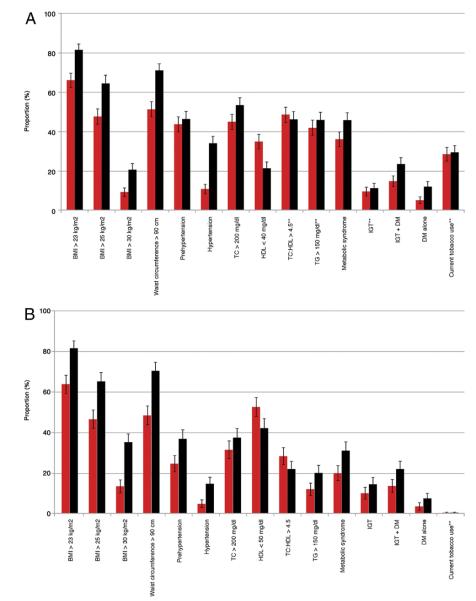
(A) Categoric anthropometric and cardiovascular disease (CVD) risk factor variable prevalence (with 95% confidence intervals [CIs]) at phases 5 (red bars) and 6 (black bars) in men from the New Delhi Birth Cohort. All differences for within-sex comparisons between participants seen in phases 5 and 6 are statistically significant unless noted (**). (B) Categoric anthropometric and CVD risk factor variable prevalence (with 95% CIs) at phases 5 and 6 in women from the New Delhi Birth Cohort. All differences for within-sex comparisons between participants seen in phases 5 and 6 are statistically significant unless noted (**). BMI = body mass index; DM = diabetes mellitus; HDL = high-density lipoprotein cholesterol; IGT = impaired glucose tolerance; TC = total cholesterol; TG = triglycerides.
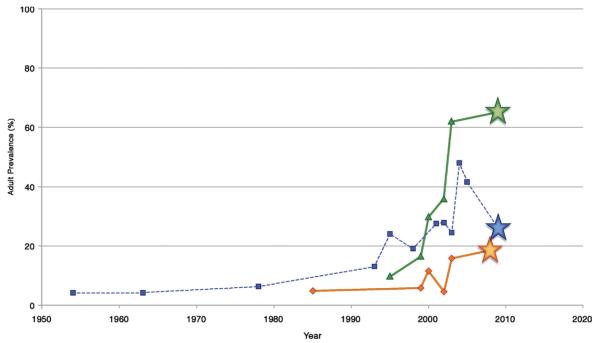
Temporal trends of the prevalence of overweight (green line), hypertension (blue line), and diabetes (orange line) in urban India (diagnosis based on laboratory testing). Each star represents the New Delhi Birth Cohort prevalence data during phase 6. Data from World Health Organization (WHO) India (4).
Comment in
-
The cardiovascular and chronic diseases epidemic in low- and middle-income countries: a global health challenge.J Am Coll Cardiol. 2011 Apr 26;57(17):1775-7. doi: 10.1016/j.jacc.2010.11.047. J Am Coll Cardiol. 2011. PMID: 21511114 No abstract available.
References
-
- Murray CJ, Lopez AD. Alternative projections of mortality and disability by cause 1990–2020: Global Burden of Disease Study. Lancet. 1997;349:1498–504. - PubMed
-
- Gupta R, Joshi P, Mohan V, Reddy KS, Yusuf S. Epidemiology and causation of coronary heart disease and stroke in India. Heart. 2008;94:16–26. - PubMed
-
- Yusuf S, Hawken S, Ounpuu S, et al. Effect of potentially modifiable risk factors associated with myocardial infarction in 52 countries (the INTERHEART study): case-control study. Lancet. 2004;364:937–52. - PubMed
-
- World Health Organization (WHO) India [Accessed April 29, 2010];National cardiovascular disease database. Available at: http://www.whoindia.org/LinkFiles/NMH_Resources_National_CVD_database-Fi....
Publication types
MeSH terms
Grants and funding
LinkOut - more resources
Full Text Sources
Medical
