. 2011 May 20;332(6032):966-70.
doi: 10.1126/science.1205407. Epub 2011 Apr 21.

Spatial coupling of mTOR and autophagy augments secretory phenotypes

Affiliations

Spatial coupling of mTOR and autophagy augments secretory phenotypes

Masako Narita et al. Science. .

Abstract

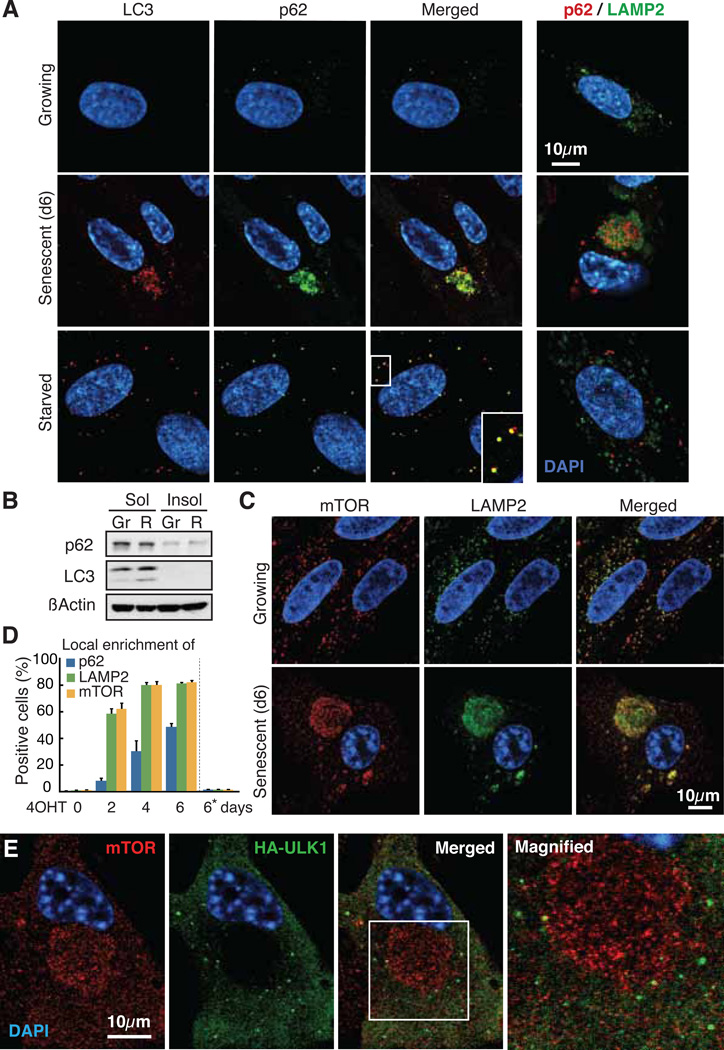
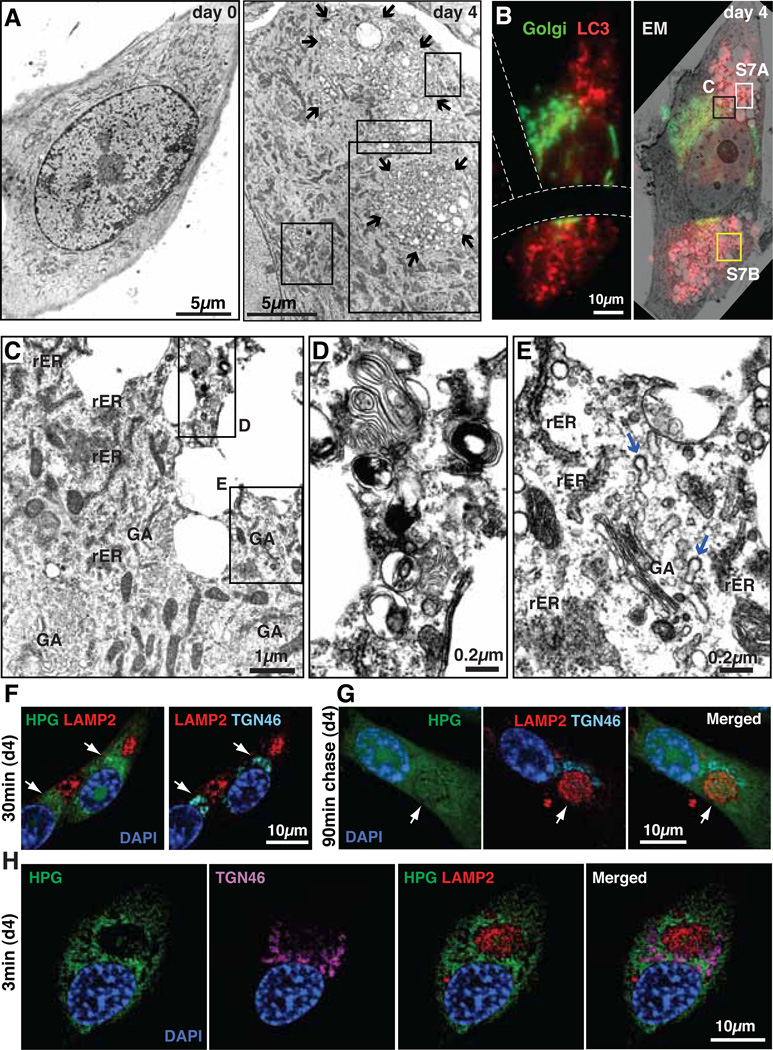
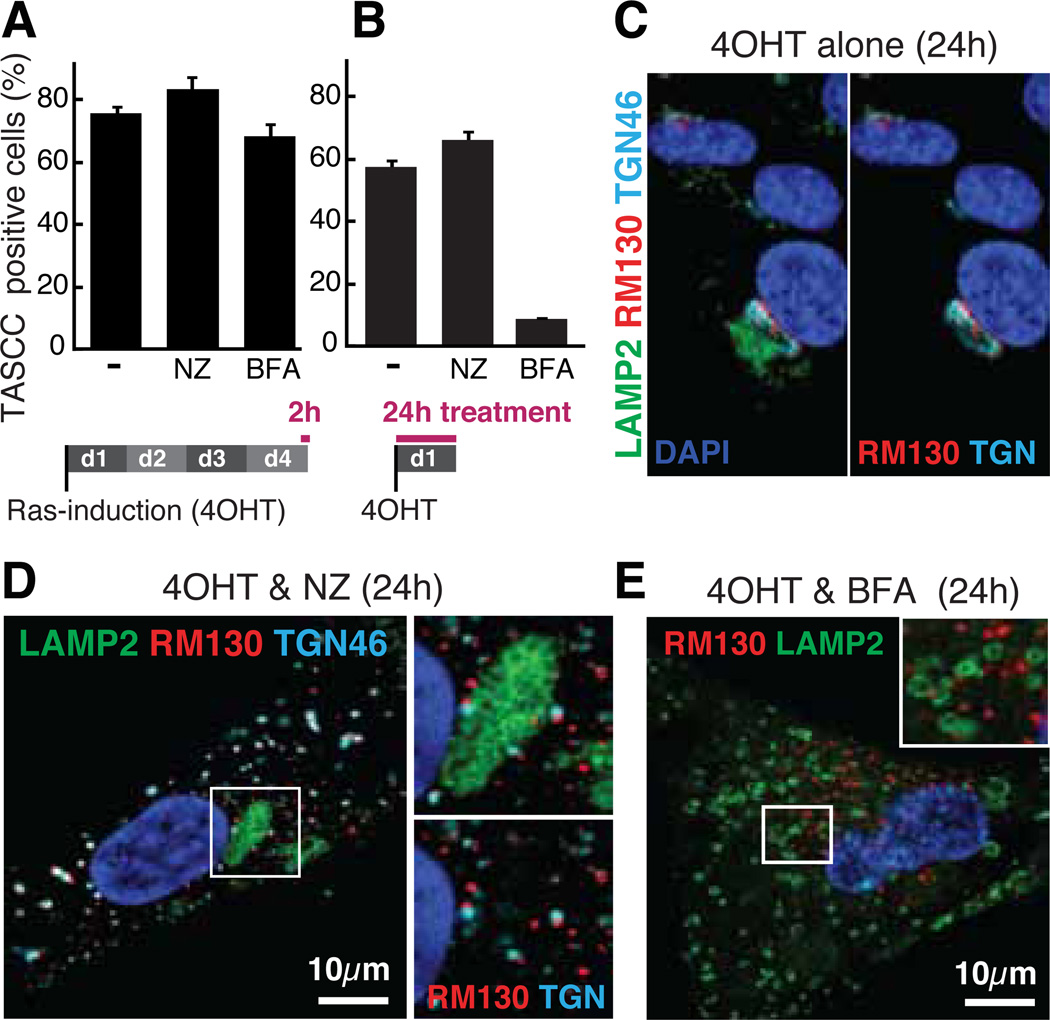
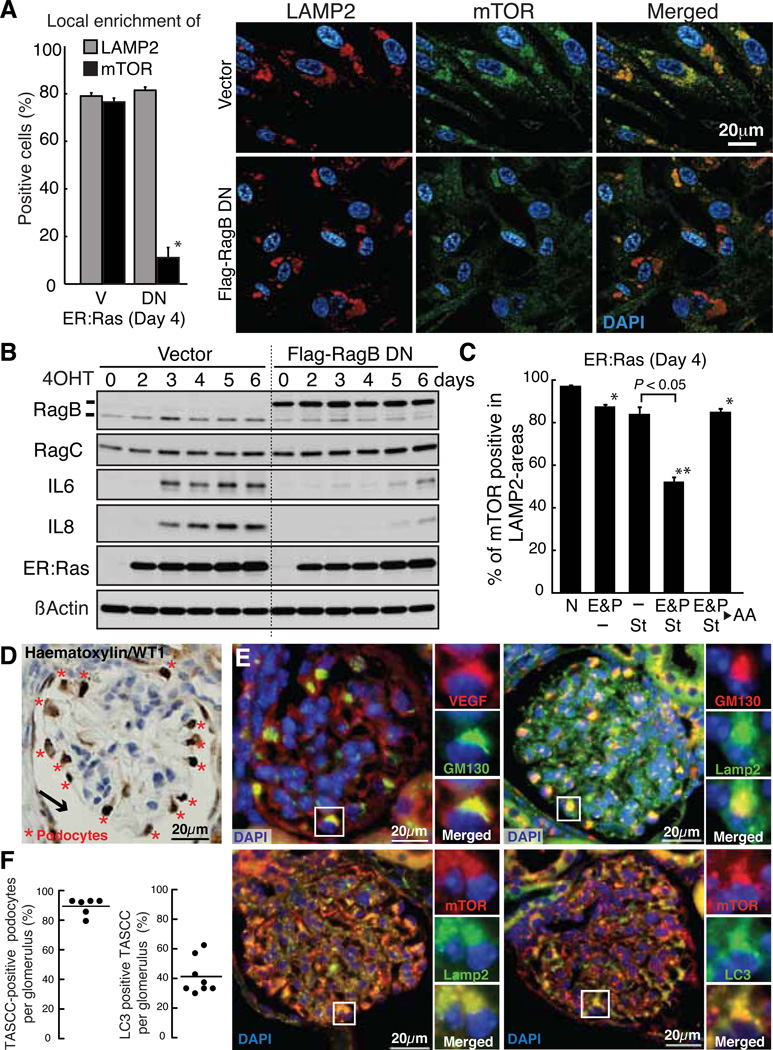
Protein synthesis and autophagic degradation are regulated in an opposite manner by mammalian target of rapamycin (mTOR), whereas under certain conditions it would be beneficial if they occurred in unison to handle rapid protein turnover. We observed a distinct cellular compartment at the trans side of the Golgi apparatus, the TOR-autophagy spatial coupling compartment (TASCC), where (auto)lysosomes and mTOR accumulated during Ras-induced senescence. mTOR recruitment to the TASCC was amino acid- and Rag guanosine triphosphatase-dependent, and disruption of mTOR localization to the TASCC suppressed interleukin-6/8 synthesis. TASCC formation was observed during macrophage differentiation and in glomerular podocytes; both displayed increased protein secretion. The spatial coupling of cells' catabolic and anabolic machinery could augment their respective functions and facilitate the mass synthesis of secretory proteins.


Figures

Fig. 1
Fig. 1
Spatial association between autophagy and mTOR. (A) Confocal immunofluorescence images. 4OHT was given to ER:Ras-IMR90 cells for 0 (Growing) or 6 days (Senescent). Starved, DMEM without amino acids or serum for 2h. (B) Immunoblot analysis for indicated proteins in 1% Triton-X100 soluble (Sol) and insoluble (Insol) fractions from growing (Gr) and Ras-induced senescent (R) cells. (C) Confocal images of mTOR and LAMP2 immunofluorescence. (D) Quantification of TASCC-formation kinetics (mean ± SEM; n≥3). Asterisk, parental cells treated with 4OHT for 6 days. (E) Confocal images of mTOR and HA immunofluorescence in HA-ULK1 expressing ER:Ras-IMR90 cells.
Fig. 2
Fig. 2
Spatial association between TASCC and secretory apparatus. (A) Electron microscopy (EM) of ER:Ras-IMR90 cells. 4OHT was given for 0 or 4 days. Arrows, TASCC. Regions indicated by rectangles are magnified in fig. S5. (B to E) Fluorescence-EM. LC3 (RFP) and Golgi (GFP) were BacMam system labeled at day 4. Dashed lines, grid on coverslip (B). Regions indicated by rectangles are magnified in corresponding figure panels (also fig. S7). GA, Golgi apparatus. Blue arrows, GA-derived coated vesicles. (F to H) Visualization of nascent protein synthesis during Ras-induced senescence (see fig. S9). After 30 min labeling with HPG in day 4 Ras-induced senescent cells (d4), nascent protein was accumulated in TGN (arrows), but not in the TASCC (F). After 90 min chase, nascent protein was readily detected in TASCC (arrows) (G). Short-term (3 min) labeling of HPG to visualize sites of protein synthesis (H).
Fig. 3
Fig. 3
Brefeldin A, but not nocodazole, prevents TASCC-formation. (A and B) ER:Ras-IMR90 cells were treated with 10µM nocodazole (NZ), or 40ng/ml brefeldin A (BFA), which were added after (A) or before (B) TASCC-establishment. TASCC was assessed by mTOR/LAMP2 immunofluorescence. (C to E) Representative confocal images of cells treated as in (B). RM130 and TGN46, cis- and trans-Golgi network markers, respectively.
Fig. 4
Fig. 4
Functional implication of TASCC. (A and B) ER:Ras-IMR90 cells expressing vector (V) or dominant negative mutant RagB-T54N (DN) were assessed for mTOR enrichment to LAMP2-compartments by immunofluorescence (mean ± SEM; n=3) (A). *P < 0.01 relative to V. Immunoblot analysis at time points indicated after Ras-induction (B). (C) Effect of AA-depletion on mTOR enrichment in LAMP2-compartments as in (A). Cells were incubated with AA-free medium supplemented with 10% dialyzed FBS (St) and/or lysosomal protease inhibitors, 10µg/ml E64d and 25µg/ml Pepstatin A (E&P), for 3h. N, normal medium (fig. S14). As an additional control, we restored essential AAs (▸ AA) for 30min after E&P/St treatment (mean ± SEM; n=3). *P < 0.05, **P < 0.01 relative to N. (D) Typical immunohistochemical image of mouse glomerulus. WT1, podocyte marker. Arrow, capsule space. (E) Representative images for indicated proteins in mouse glomeruli show TASCC in podocytes. (F) The percentage of TASCC-positive podocytes (left) and LC3 enrichment per TASCC-positive podocytes (right) in each glomerulus section were plotted. The dots represent glomeruli sampled from two mice.

Comment in

  • Cell biology. The TASCC of secretion.
    Zoncu R, Sabatini DM. Zoncu R, et al. Science. 2011 May 20;332(6032):923-5. doi: 10.1126/science.1207552. Science. 2011. PMID: 21596981 Free PMC article. No abstract available.

References

    1. Kuilman T, Peeper DS. Nat Rev Cancer. 2009;9:81–94. - PubMed
    1. Coppe JP, Desprez PY, Krtolica A, Campisi J. Annu Rev Pathol. 2010;5:99–118. - PMC - PubMed
    1. Young ARJ, et al. Genes & Development. 2009;23:798–803. - PMC - PubMed
    1. Wullschleger S, Loewith R, Hall MN. Cell. 2006;124:471–484. - PubMed
    1. Ma XM, Blenis J. Nat Rev Mol Cell Biol. 2009;10:307–318. - PubMed

Publication types

MeSH terms

Associated data