. 2011 Apr 22;332(6028):475-8.
doi: 10.1126/science.1202142.

Real-time observation of transcription initiation and elongation on an endogenous yeast gene

Affiliations

Real-time observation of transcription initiation and elongation on an endogenous yeast gene

Daniel R Larson et al. Science. .

Abstract

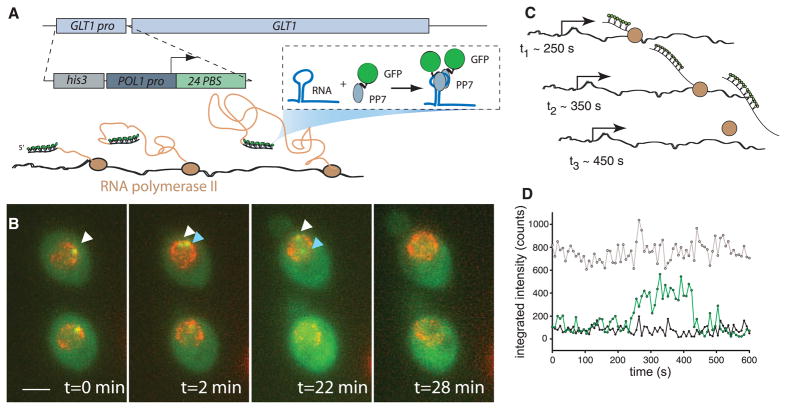
Cellular messenger RNA levels are achieved by the combinatorial complexity of factors controlling transcription, yet the small number of molecules involved in these pathways fluctuates stochastically. It has not yet been experimentally possible to observe the activity of single polymerases on an endogenous gene to elucidate how these events occur in vivo. Here, we describe a method of fluctuation analysis of fluorescently labeled RNA to measure dynamics of nascent RNA--including initiation, elongation, and termination--at an active yeast locus. We find no transcriptional memory between initiation events, and elongation speed can vary by threefold throughout the cell cycle. By measuring the abundance and intranuclear mobility of an upstream transcription factor, we observe that the gene firing rate is directly determined by trans-activating factor search times.


Figures

Fig. 1
Fig. 1
Real-time measurement of fluorescent RNA reveals transcription kinetics. (A) Diagram of the POL1pro-GLT1 reporter gene, obtained by replacing the GLT1 promoter with a cassette containing a his5 marker, POL1 promoter, and 24 PBS. (B) Time-dependent activity of individual reporter genes (PP7-GFP, green; Nup49-tomato, red). At time t = 0 min, both cells show a TS near the periphery of the nucleus. At t = 2 min, an additional TS corresponding to the duplicated gene has turned on in the upper cell (white and blue arrows). At t = 22 min, the nascent bud is visible in both cells, and the TSs of the upper cell are present at opposite sides of the nucleus, but the lower cell TS has turned off. At t = 28 min, the bud continues to grow, and both TSs have turned off. All images are maximum projected z-stacks. Scale bar indicates 3 μm. (C and D) Diagram of RNAPII progression on the gene with corresponding intensity trace (green line). The gray line is the intensity of a cytosolic mRNA; the black line is a background intensity at an arbitrary position in the nucleus measured by using the fitting algorithm (movie S2).
Fig. 2
Fig. 2
Direct measurement of transcription initiation and elongation of the POL1p-GLT1 gene with fluctuation analysis. (A) TS intensity trajectory (green) compared to background (black). (B) Diagram of RNAPII occupancy based on the intensity data from (A). At time t1, a single RNAPII is loaded on the gene; at t2, multiple RNAPIIs load in rapid succession before the first has finished polymerization; at t3, the first RNAPII has terminated; at t4, the TS is devoid of nascent RNA. (C) Diagram of a single transcript intensity trajectory. After promoter clearance, RNAPII proceeds through the 24 stem loops, resulting in a discrete fluorescence increase upon PP7-GFP binding. After this 1.5-kb cassette, RNAPII continues through the gene, and the fluorescence is level. Upon completion of the transcript, there is a decrease corresponding to the brightness of a single transcript. (D) Autocorrelation function for transcription. The analytical solution (black curve) is compared to a Monte Carlo simulation (red circles) and the approximation for a long gene (Eq. 1) (gray curve). (E) Autocorrelation for POL1p-GLT1. The autocorrelation (red circles) is fit with Eq. 1. n = 10 cells. Error bars indicate SEM.
Fig. 3
Fig. 3
The housekeeping gene MDN1 shows variable elongation rate. (A) Diagram of the MDN1 gene with the PP7 cassette inserted either in the 5′ or the 3′UTR of MDN1 at the endogenous locus. (B and C) Visualization of TS and cytosolic mRNA (PP7-GFP, green; Nup49-tomato, red) for the PP7-MDN1 and MDN1-PP7 genes, respectively. A TS is designated with a blue arrowhead; cytosolic transcripts are designated by white arrowheads. Scale bar, 3 μm. (D) Diagram of the fluorescence time traces for MDN1 with stem loops in the 5′ or 3′UTR, PP7-MDN1 and MDN1-PP7. (E and F) Intensity trajectories of single PP7-MDN1 and MDN1-PP7 sites. (G) PP7-MDN1 transcription kinetics in G1 cells. The PP7-MDN1 autocorrelation was fit with Eq. 1. n = 10 cells. (H) MDN1-PP7 transcription kinetics in G1 cells. The MDN1-PP7 autocorrelation was fit with Eq. 2. n = 10 cells. (I) PP7-MDN1 transcription kinetics in late S/G2/M. The PP7-MDN1 autocorrelation was fit with Eq. 1. n = 10 cells. Error bars indicate SEM. Cell cycle stage was determined by size, nuclear morphology, budding index, and presence of multiple alleles (fig. S8).
Fig. 4
Fig. 4
Mbp1p-GFP transactivator dynamics in the yeast nucleus. 2PE-FCS autocorrelation of Mbp1p-GFP (red circles) and NLS-GFP (green circles), n = 25 and 17 cells, respectively. Mbp1p-GFP autocorrelation was fit to a model of reaction diffusion on the basis of transitions between free diffusion (light-gray curve) and nonspecific binding to chromatin (dark gray curve). Concentration of Mbp1-GFP = 60 ± 16 nM; D = 0.6 ± 0.1 μm2/s; τ3D = 1.1 ± 0.2 s; τ1D = 0.8 ± 0.1 s. NLS-GFP was fit to a simple diffusion model with D = 2.7 ± 0.4 μm2/s. Error bars indicate SEM.

Comment in

References

    1. Venters BJ, Pugh BF. Genome Res. 2009;19:360. - PMC - PubMed
    1. Harbison CT, et al. Nature. 2004;431:99. - PMC - PubMed
    1. Hager GL, McNally JG, Misteli T. Mol Cell. 2009;35:741. - PMC - PubMed
    1. Darzacq X, et al. Annu Rev Biophys. 2009;38:173. - PMC - PubMed
    1. Bertrand E, et al. Mol Cell. 1998;2:437. - PubMed

Publication types

MeSH terms