

Sex differences in application, success, and funding rates for NIH extramural programs
- PMID: 21512358
- PMCID: PMC3379556
- DOI: 10.1097/ACM.0b013e31821836ff
Sex differences in application, success, and funding rates for NIH extramural programs
Abstract
Purpose: The authors provide an analysis of sex differences in National Institutes of Health (NIH) award programs to inform potential initiatives for promoting diversity in the research workforce.
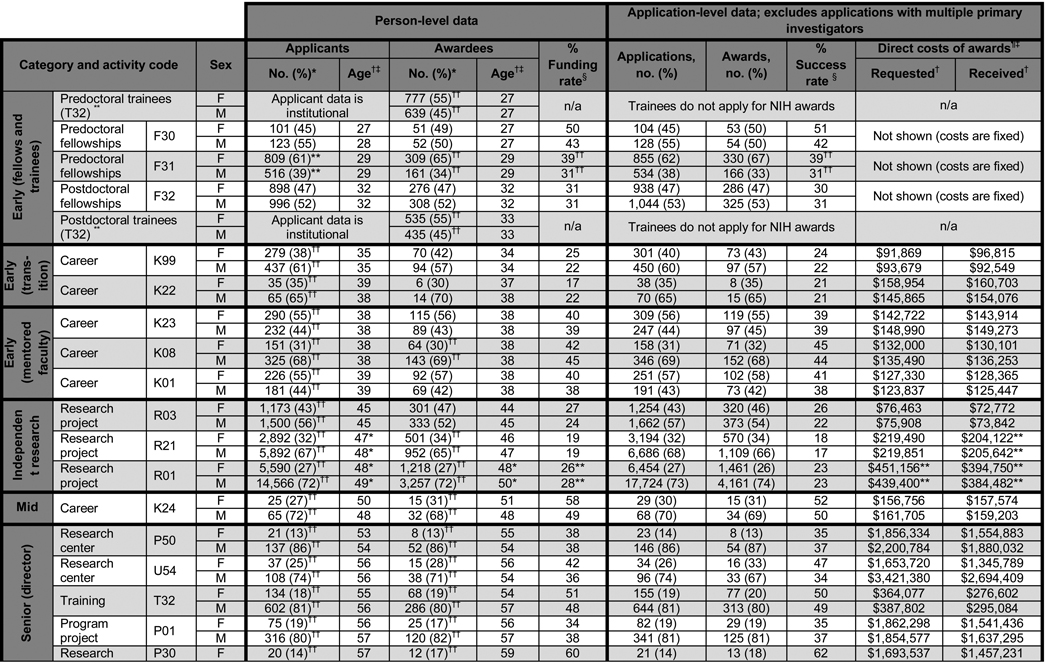
Method: In 2010, the authors retrieved data for NIH extramural grants in the electronic Research Administration Information for Management, Planning, and Coordination II database and used statistical analysis to determine any sex differences in securing NIH funding, as well as subsequent success of researchers who had already received independent NIH support.
Results: Success and funding rates for men and women were not significantly different in most award programs. Furthermore, in programs where participation was lower for women than men, the disparity was primarily related to a lower percentage of women applicants compared with men, rather than decreased success rates or funding rates. However, for subsequent grants, both application and funding rates were generally higher for men than for women.
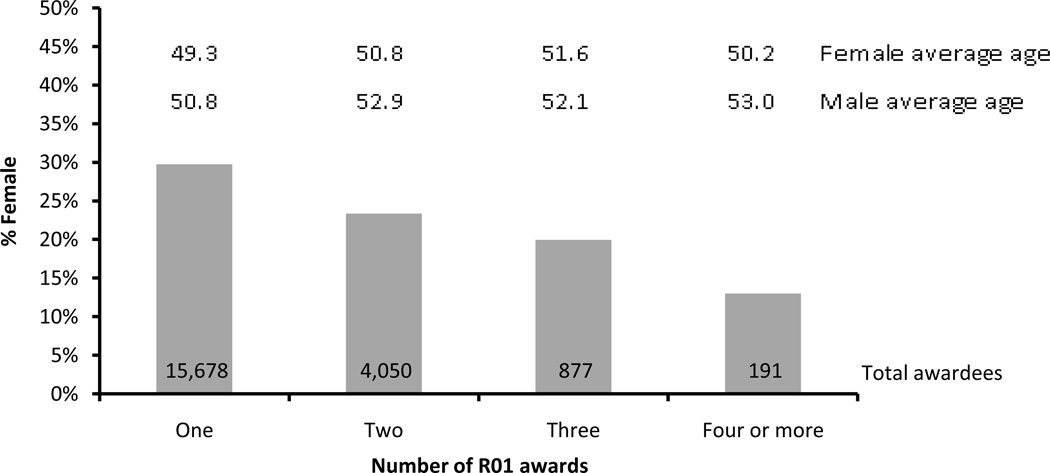
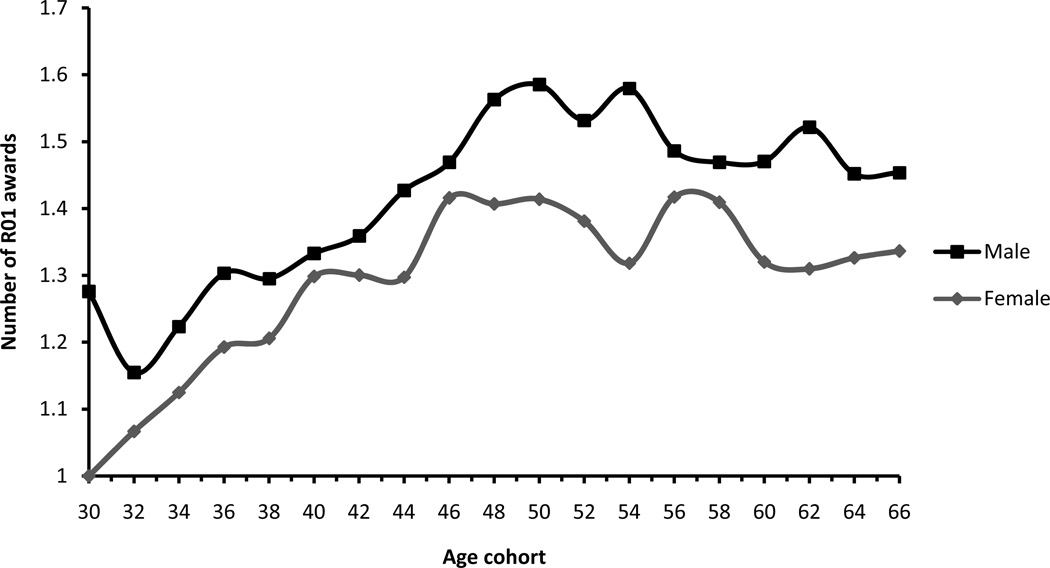
Conclusions: Cross-sectional analysis showed that women and men were generally equally successful at all career stages, but longitudinal analysis showed that men with previous experience as NIH grantees had higher application and funding rates than women at similar career points. On average, although women received larger R01 awards than men, men had more R01 awards than women at all points in their careers. Therefore, while greater participation of women in NIH programs is under way, further action will be required to eradicate remaining sex differences.
Figures

References
-
- U.S. National Science Foundation. Science Resources Statistics Division. Survey of Earned Doctorates. [Accessed February 14, 2011]; Available at http://www.nsf.gov/statistics/srvydoctorates/
-
- Association of American Medical Colleges. U.S. Medical School Faculty. [Accessed February 14, 2011]; Available at https://www.aamc.org/data/facultyroster/69032/facultyroster_reports.html.
-
- Committee on Maximizing the Potential of Women in Academic Science and Engineering, National Academy of Sciences, National Academy of Engineering, and Institute of Medicine. Washington, DC: National Academy Press; 2007. Beyond Bias and Barriers: Fulfilling the Potential of Women in Academic Science and Engineering. - PubMed
-
- National Institutes of Health. Bethesda, MD: National Institutes of Health, Division of Research Grants, Statistics, Analysis and Evaluation Section; 1994. Women in NIH Extramural Grant Programs, Fiscal Years 1981–1990.
-
- National Institutes of Health. Bethesda, MD: National Institutes of Health, Division of Research Grants, Statistics, Analysis and Evaluation Section; 1994. Women in NIH Extramural Grant Programs, Fiscal Years 1982–1991.
Publication types
MeSH terms
Grants and funding
LinkOut - more resources
Full Text Sources
