

Biomechanical and injury response to posterolateral loading from torso side airbags
- PMID: 21512911
- PMCID: PMC3820120
- DOI: 10.4271/2010-22-0012
Biomechanical and injury response to posterolateral loading from torso side airbags
Abstract
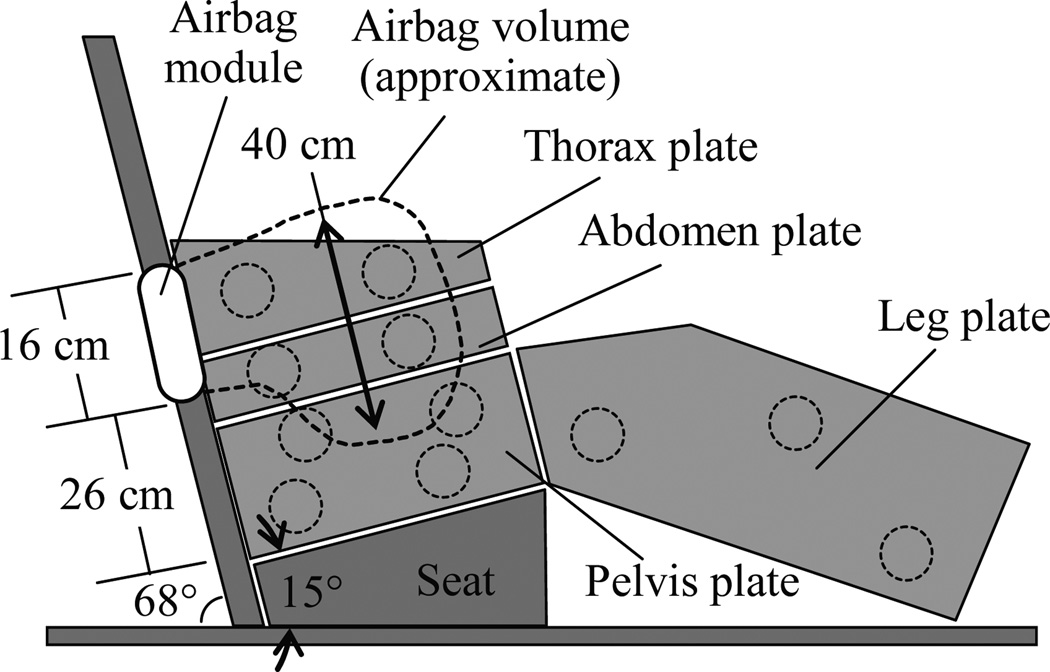
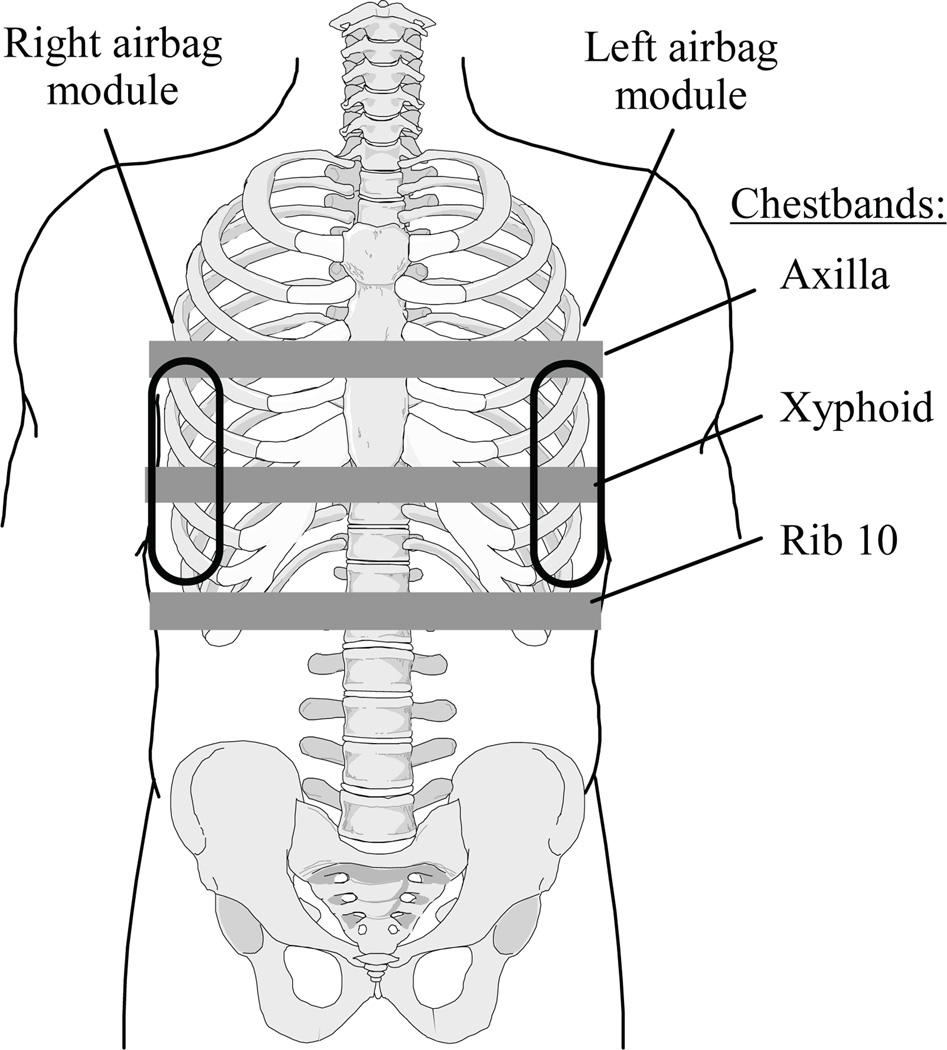
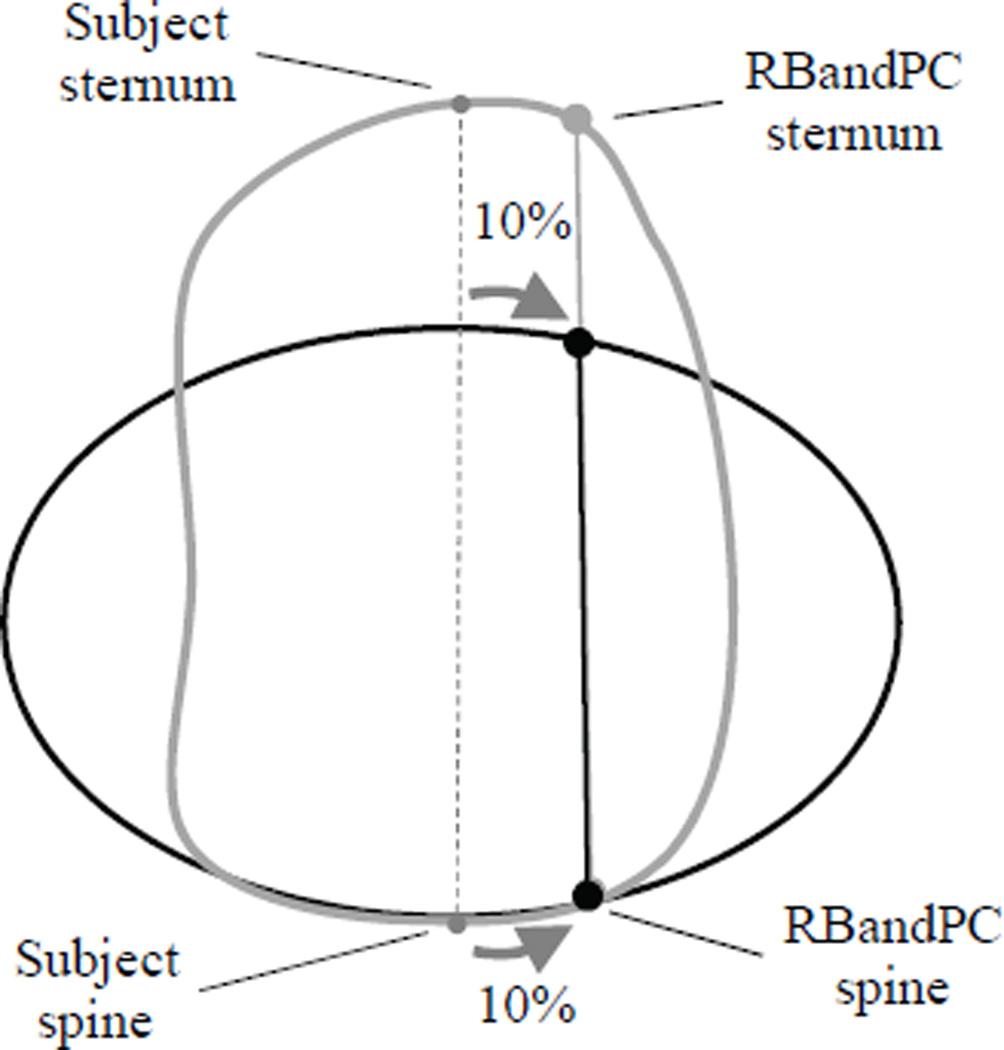
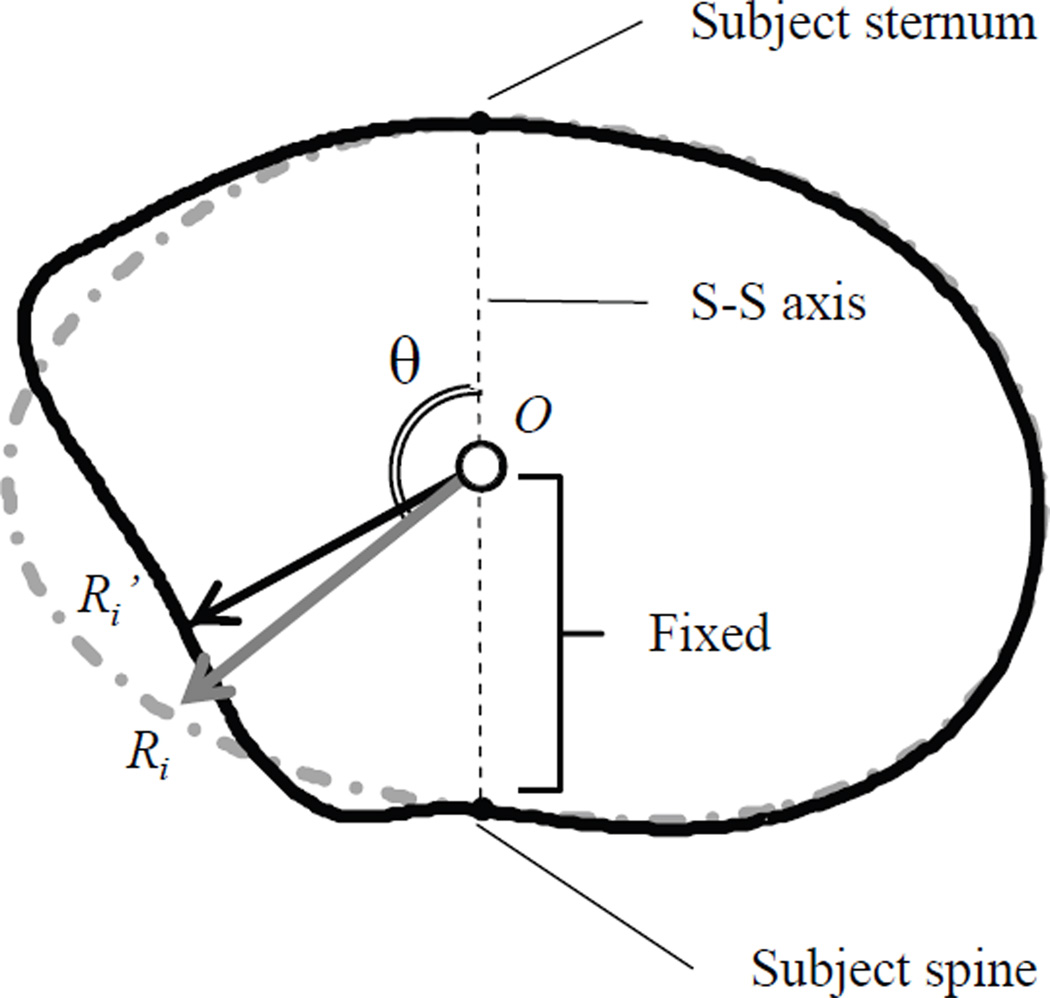
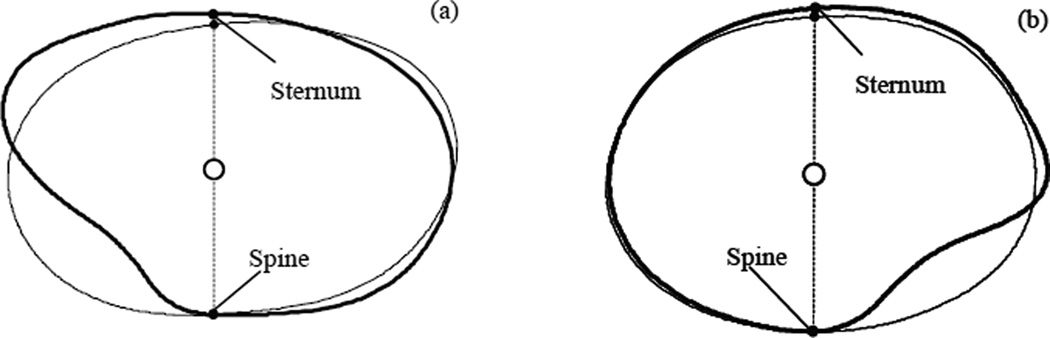
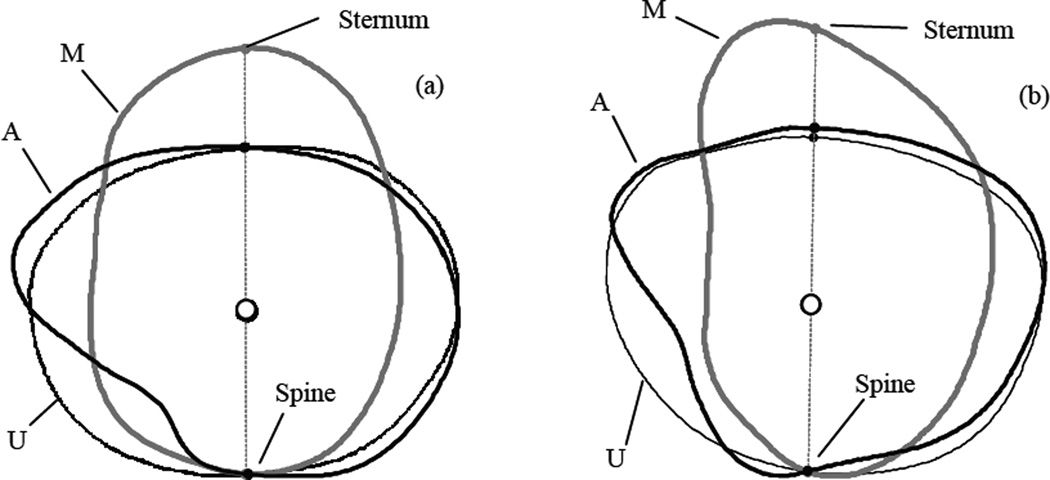
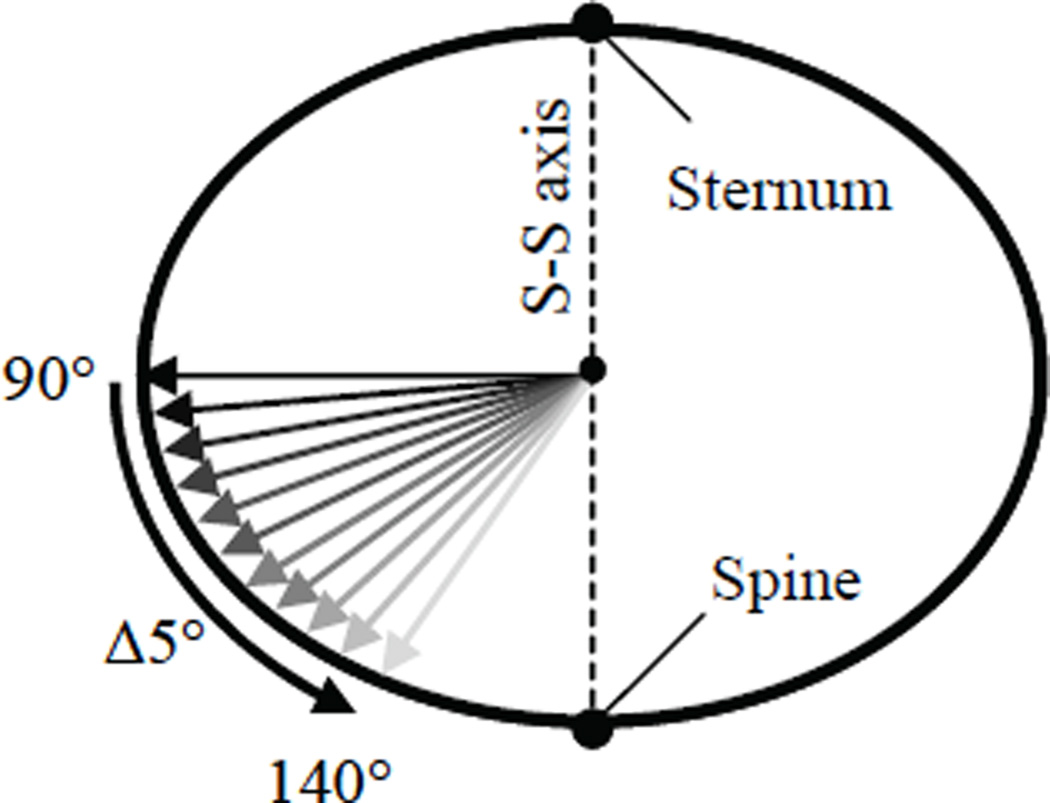
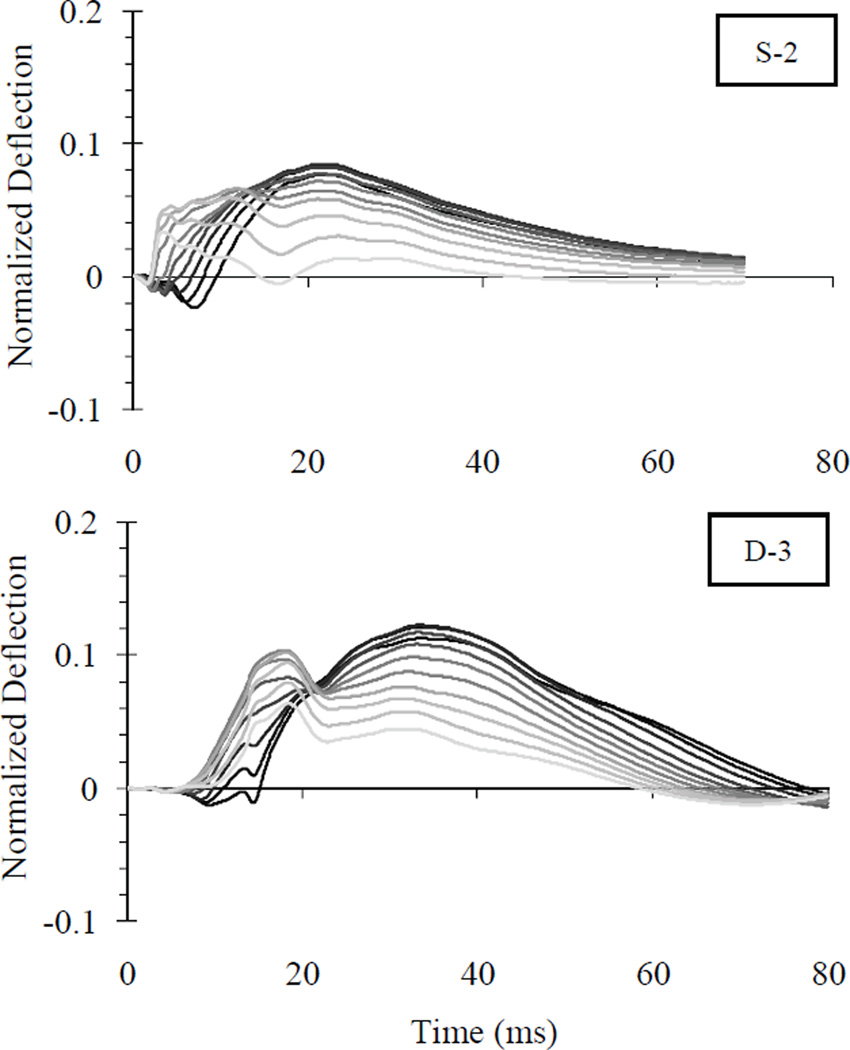
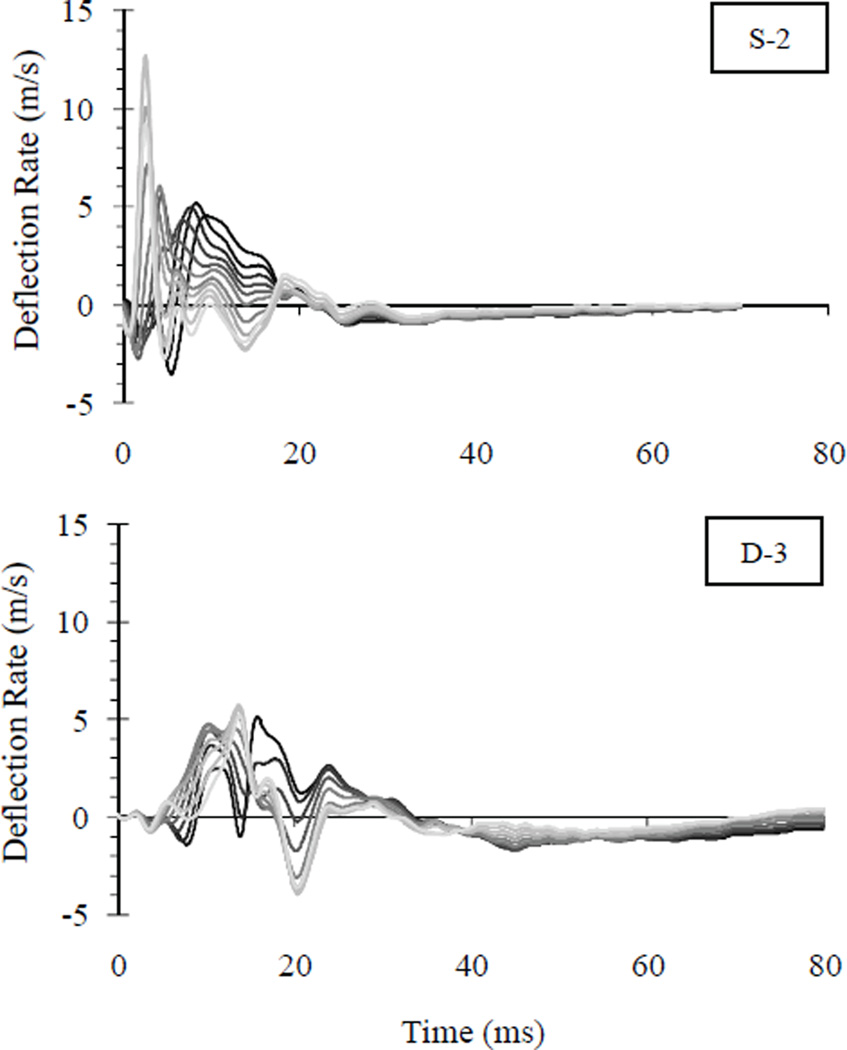
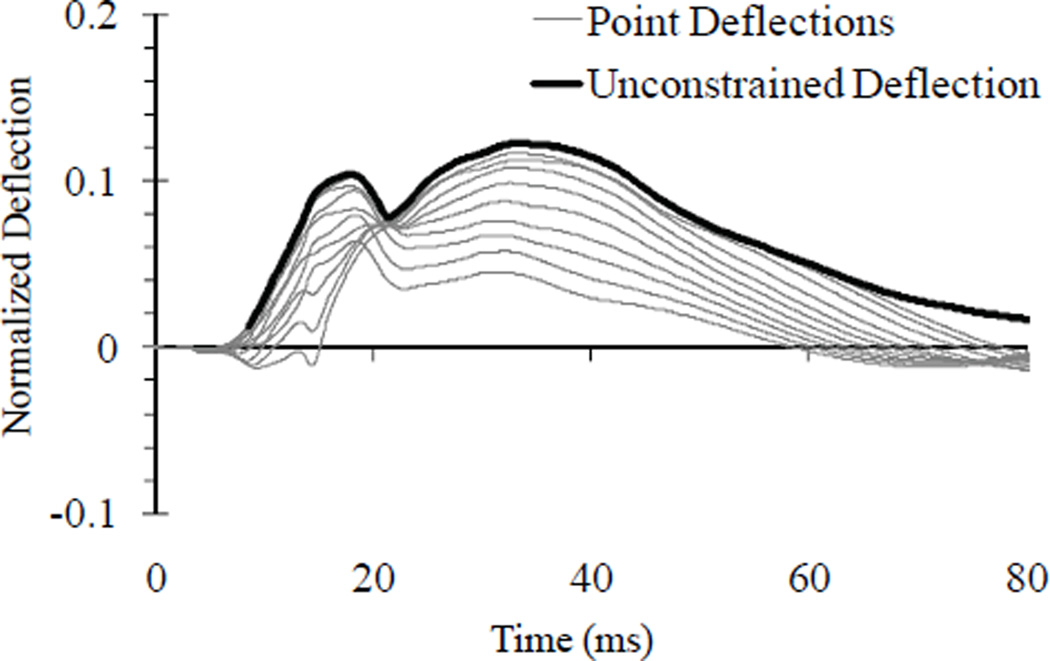
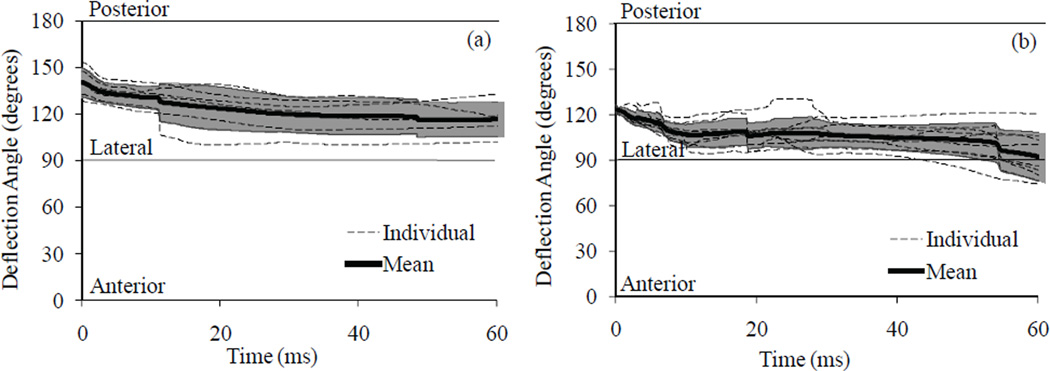
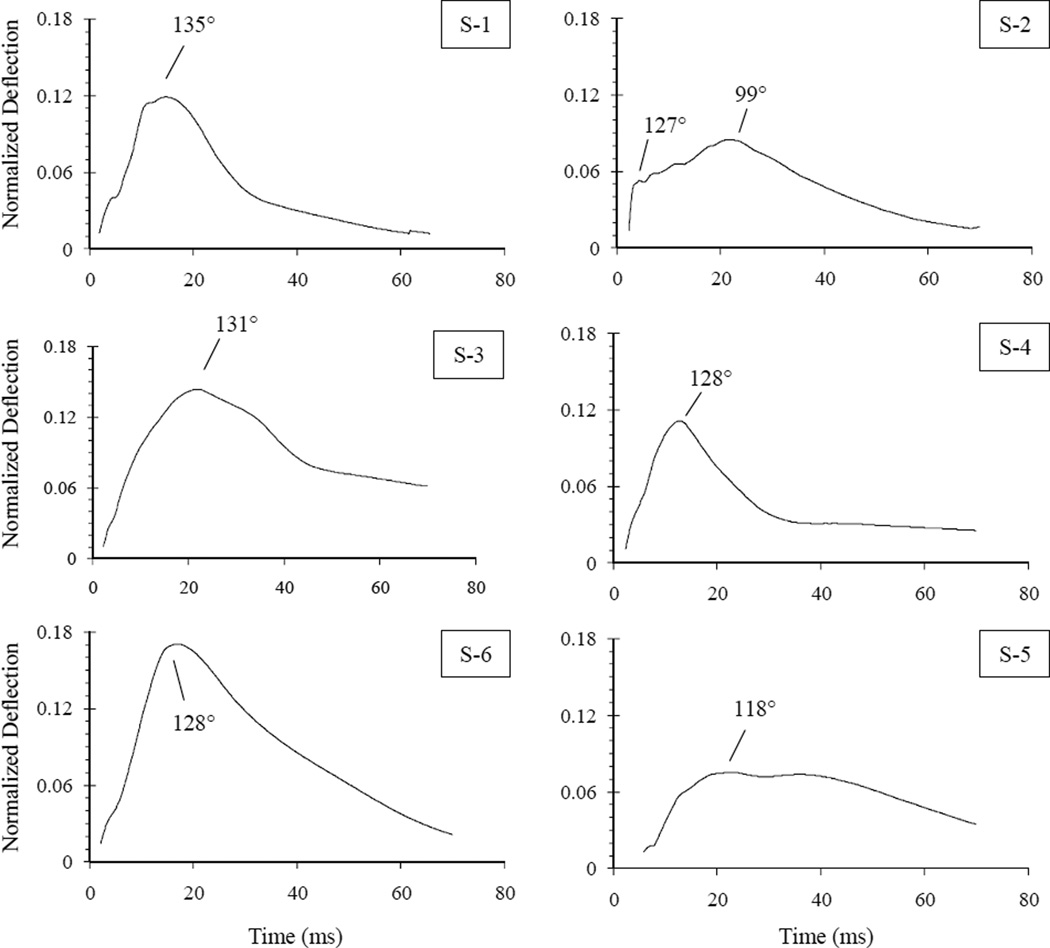
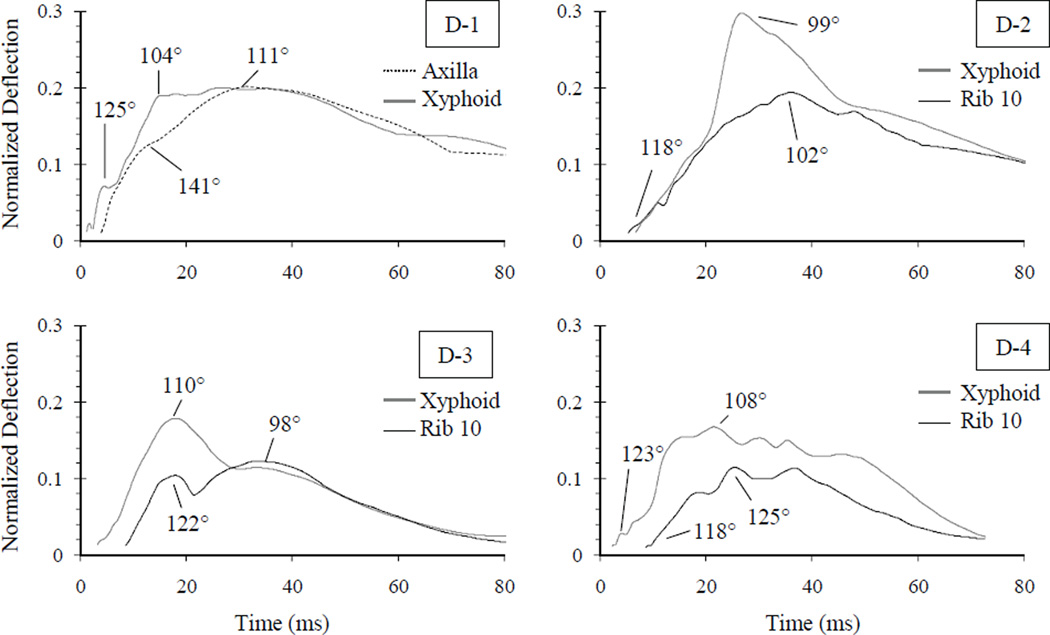
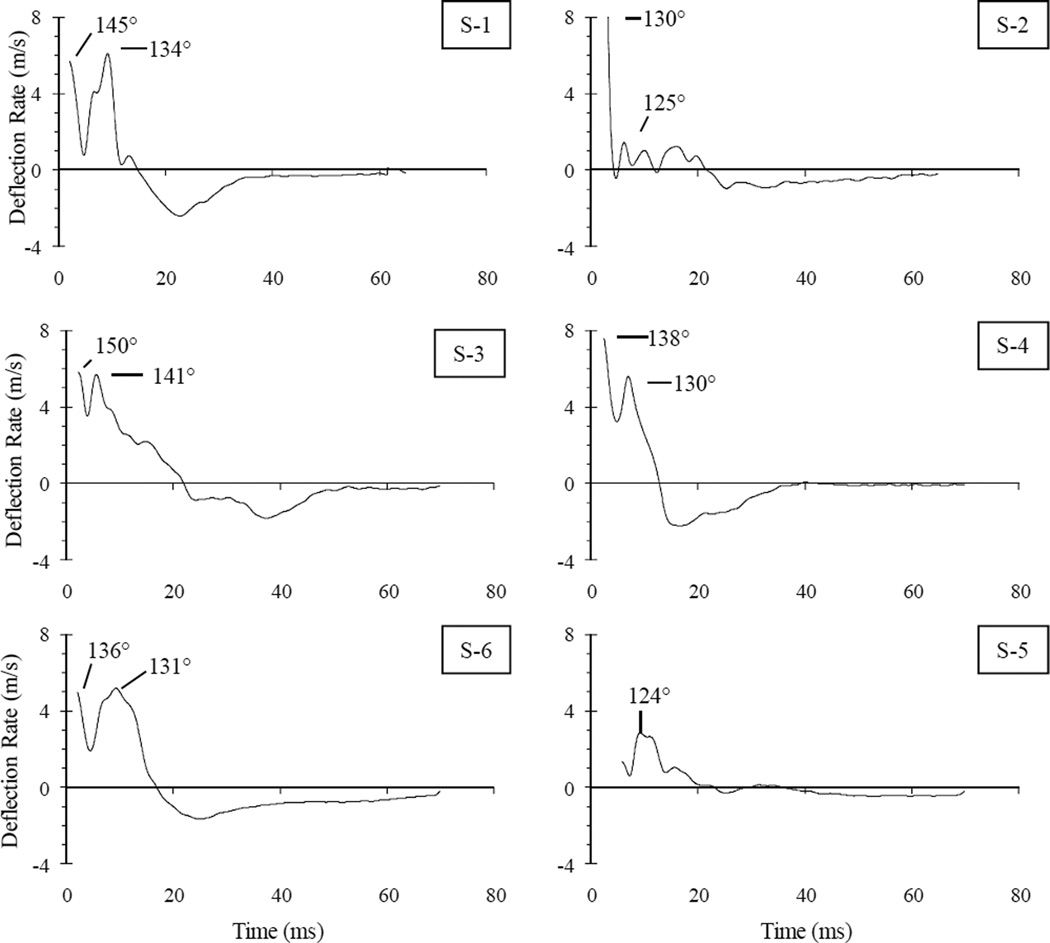
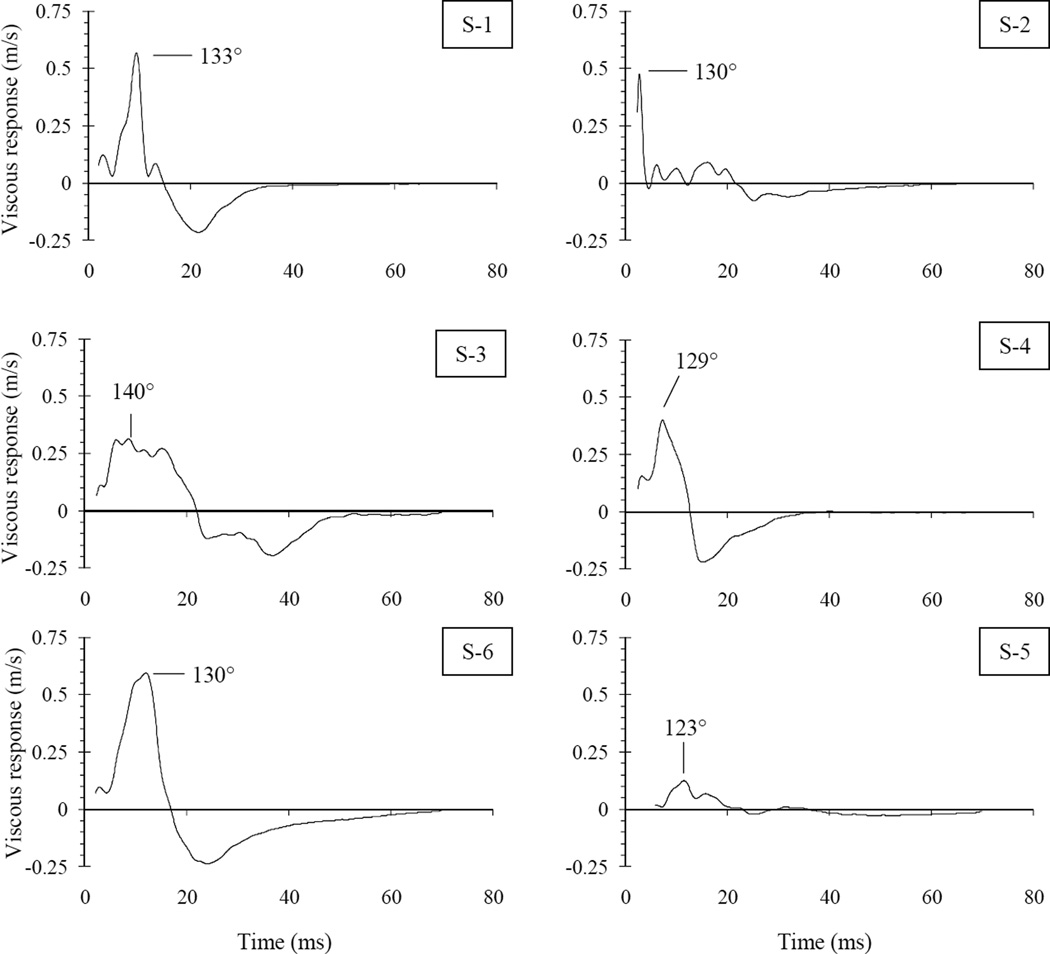
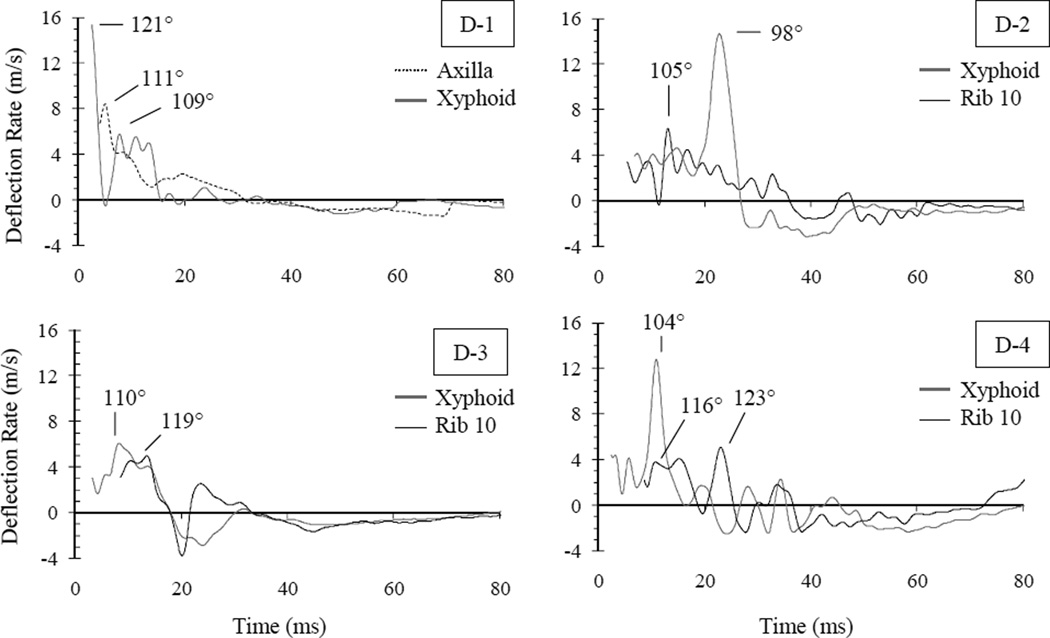
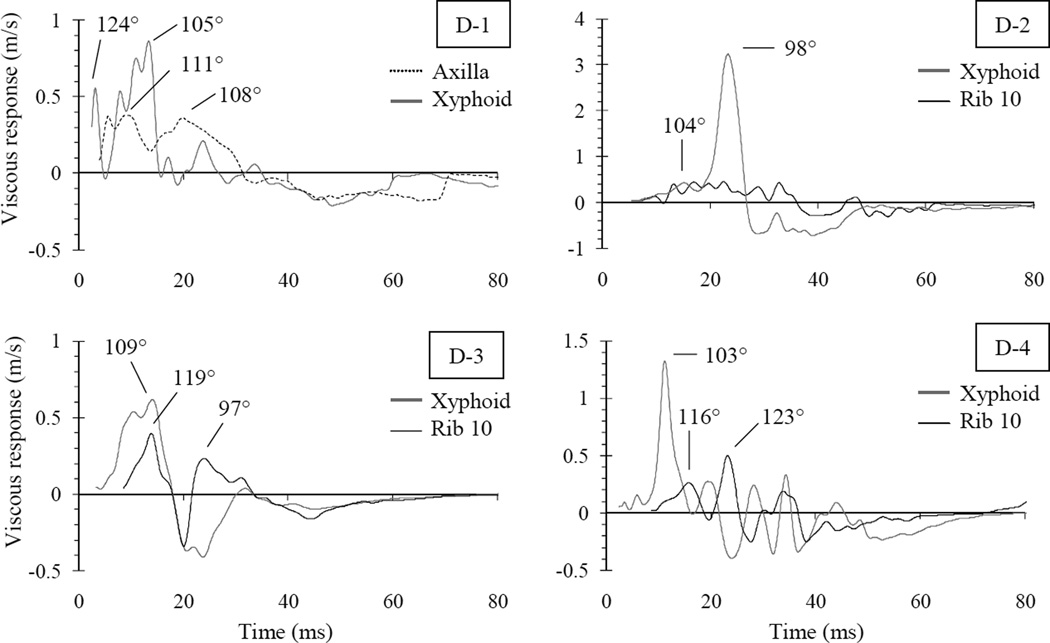
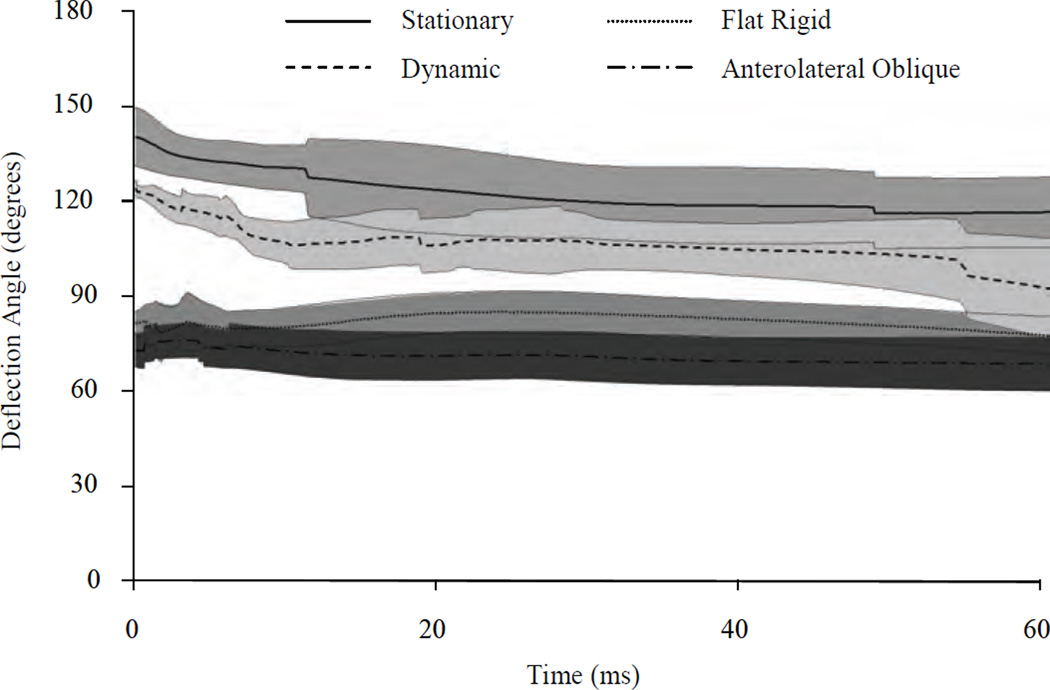
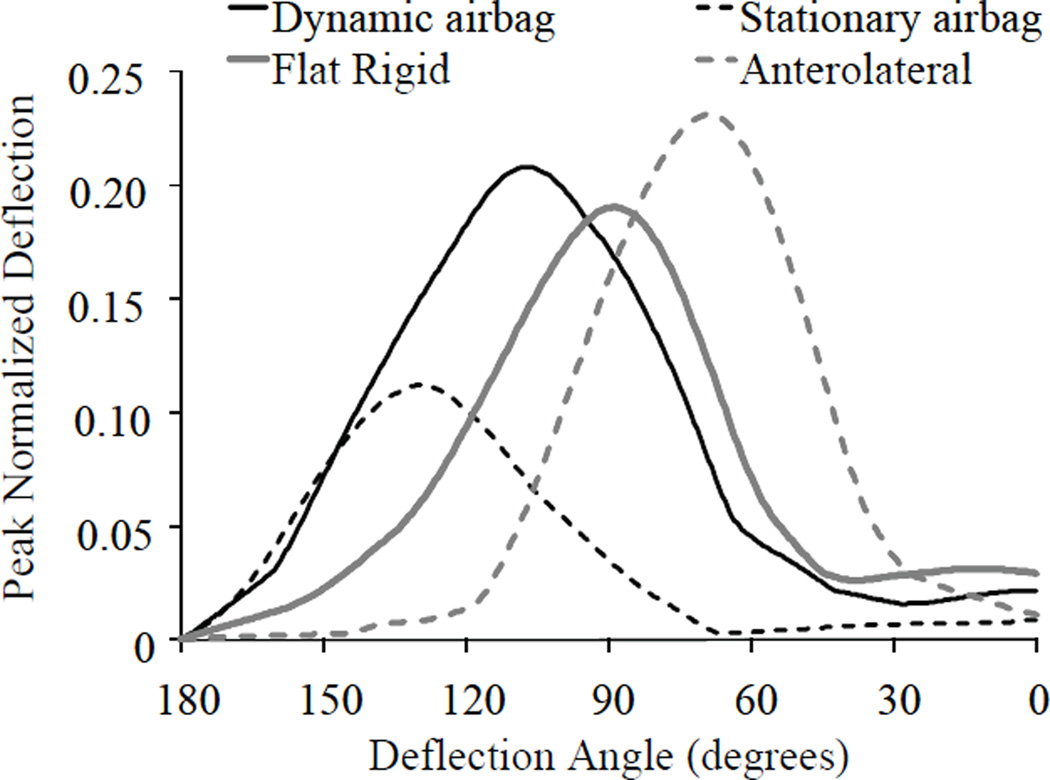
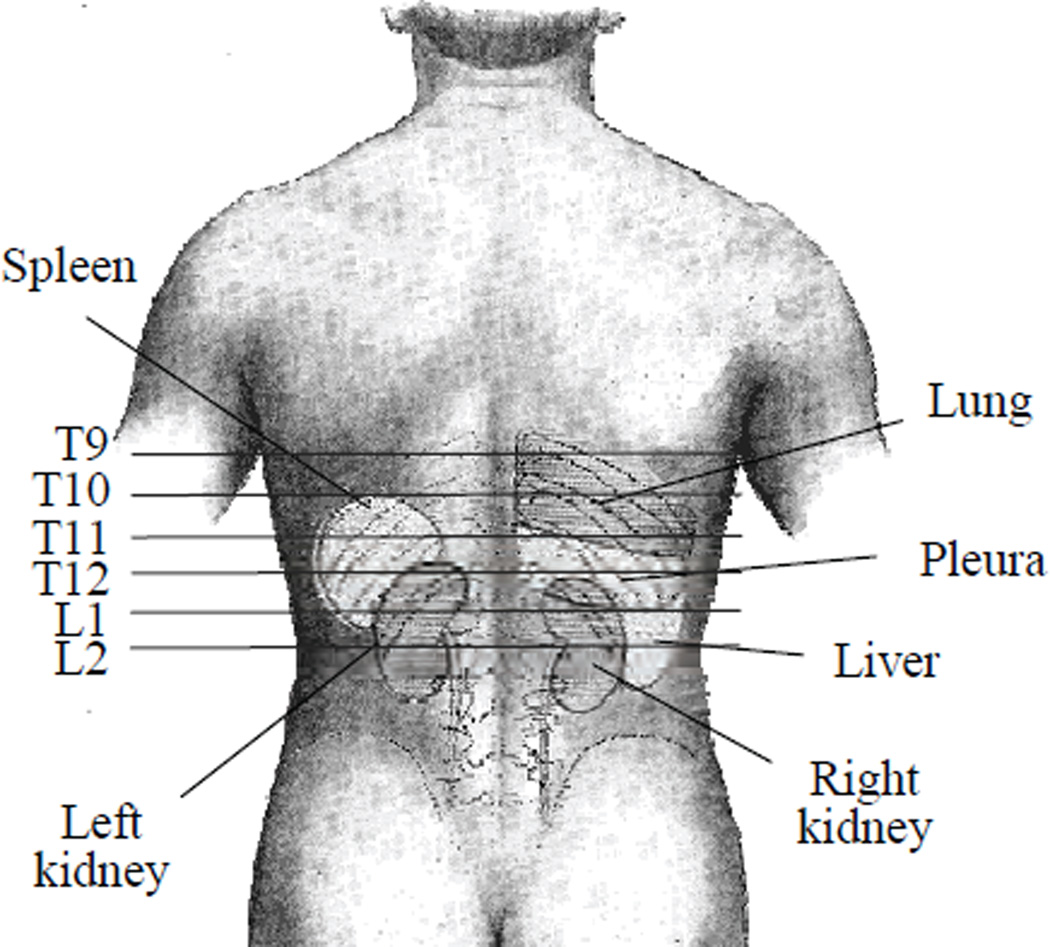
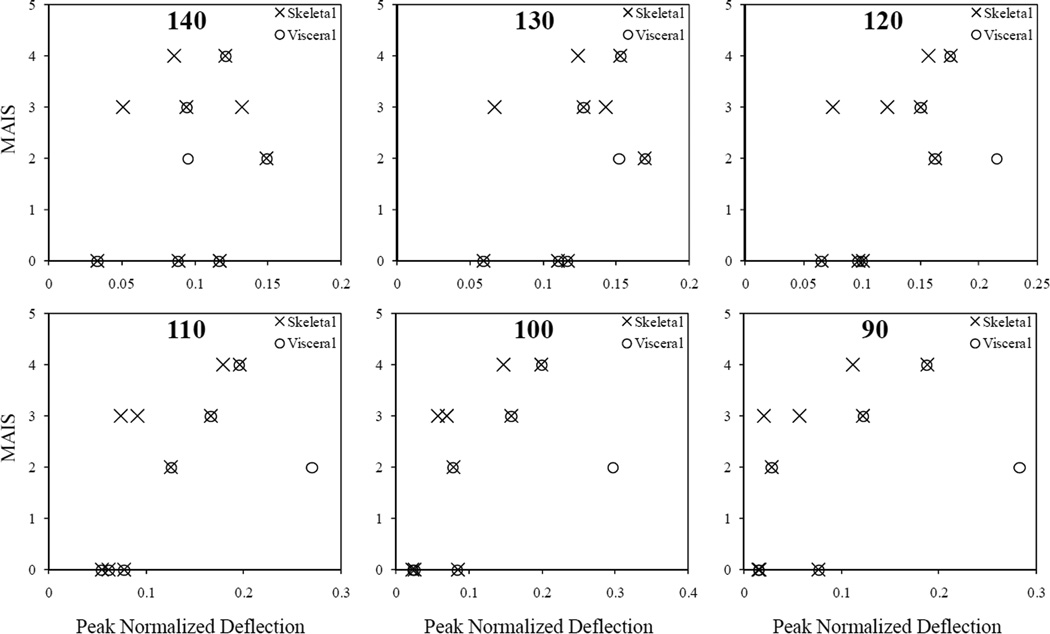
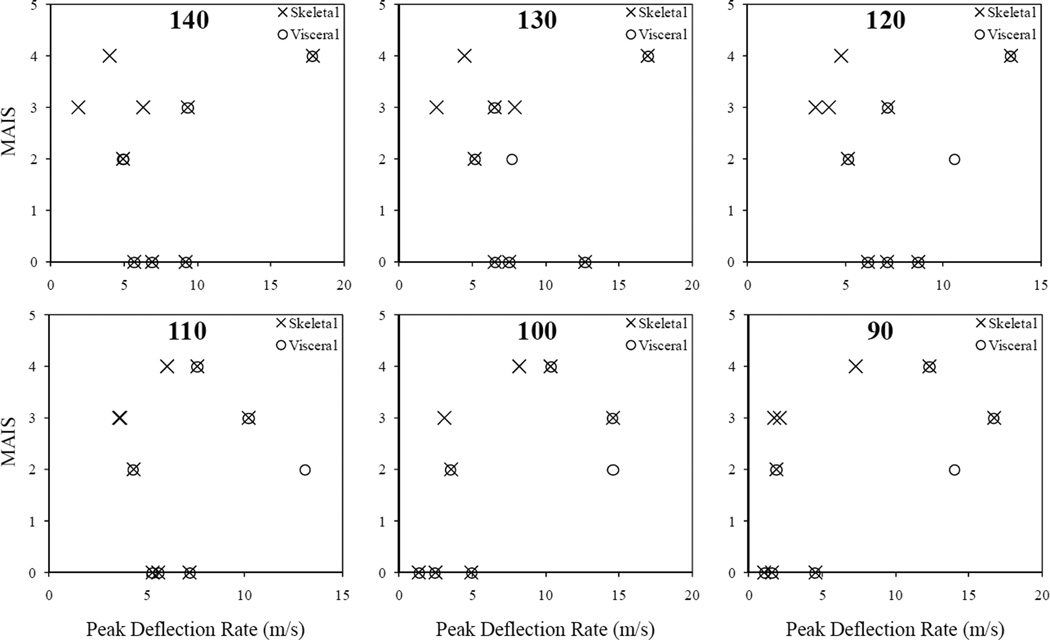
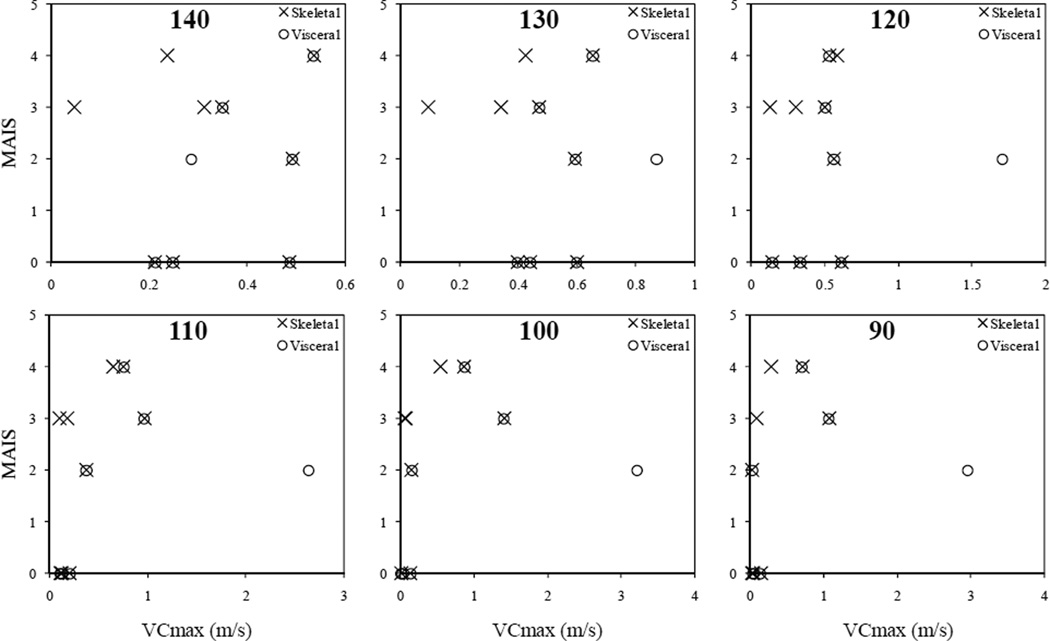
This study characterized thoracoabdominal response to posterolateral loading from a seat-mounted side airbag. Seven unembalmed post-mortem human subjects were exposed to ten airbag deployments. Subjects were positioned such that the deploying airbag first contacted the posterolateral thorax between T6 and L1 while stationary (n = 3 x 2 aspects) or while subjected to left lateral sled impact at ΔV = 6.7 m/s (n = 4). Chestband contours were analyzed to quantify deformation direction in the thoracic x-y plane (zero degrees indicating anterior and 180° indicating posterior), magnitude, rate, and viscous response. Skeletal injuries were consistent with posterolateral contact; visceral injuries consisted of renal (n = 1) or splenic (n = 3) lacerations. Deformation direction was transient during sled impact, progressing from 122 ± 5° at deformation onset to 90° following maximum deflection. Angles from stationary subjects progressed from 141 ± 9° to 120°. Peak normalized deflections, peak rates, and VCmax ranges were 0.075 - 0.171, 3.7 - 12.7 m/s, and 0.3 - 0.6 m/s with stationary airbag, respectively; ranges were 0.167 - 0.297, 7.4 - 18.3 m/s, and 0.7 - 3.0 m/s with airbag sled impact, respectively. Peak deflections were measured at angles between 99° - 135° and 98° - 125° for stationary and dynamic conditions, respectively. Because of deflection angle transience and localized injury response, both posterolateral and lateral injury metrics may be required for this boundary condition. Contrasted with flat rigid or anterolateral loading, biomechanical response to side airbag interaction may be augmented by peak normalized deflection or VCmax at 130°.
Figures
Similar articles
-
THOR dummy chest deflection response in oblique and lateral far-side sled tests.Traffic Inj Prev. 2019;20(sup1):S32-S37. doi: 10.1080/15389588.2019.1593389. Traffic Inj Prev. 2019. PMID: 31381439
-
Splenic trauma as an adverse effect of torso-protecting side airbags: biomechanical and case evidence.Ann Adv Automot Med. 2009 Oct;53:13-24. Ann Adv Automot Med. 2009. PMID: 20184829 Free PMC article.
-
Compression-based injury variables from chestbands in far-side impact THOR sled tests.Traffic Inj Prev. 2019;20(sup2):S179-S182. doi: 10.1080/15389588.2019.1661681. Epub 2019 Nov 1. Traffic Inj Prev. 2019. PMID: 31674854
-
Chest injuries of elderly postmortem human surrogates (PMHSs) under seat belt and airbag loading in frontal sled impacts: Comparison to matching THOR tests.Traffic Inj Prev. 2018;19(sup2):S55-S63. doi: 10.1080/15389588.2018.1542139. Epub 2018 Dec 13. Traffic Inj Prev. 2018. PMID: 30543304
-
Biomechanics of side impact: injury criteria, aging occupants, and airbag technology.J Biomech. 2007;40(2):227-43. doi: 10.1016/j.jbiomech.2006.01.002. Epub 2006 Mar 9. J Biomech. 2007. PMID: 16527285 Free PMC article. Review.
References
-
- AAAM. Abbreviated Injury Scale - 2005 Edition. Barrington, IL.: Association for the Advancement of Automotive Medicine; 2005.
-
- Automotive News. U.S. Car Sales by Nameplate. 2008
-
- Bergman RA, Heidger PM, Scott-Conner CEH. The Anatomy of the Spleen. USA: Humana Press; 2002. pp. 3–10.
-
- Cavanaugh JM, Wililko T, Chung J, King AI. Proc. 40th Stapp Car Crash Conference. Warrendale, PA.: Society of Automotive Engineers; 1996. Abdominal injury and response in side impact; pp. 1–16.
-
- Cavanaugh JM, Zhu Y, Huang Y, King AI. Proc. 37th Stapp Car Crash Conference. Warrendale, PA.: Society of Automotive Engineers; 1993. Injury and response of the thorax in side impact cadaveric tests; pp. 199–221.
Publication types
MeSH terms
Grants and funding
LinkOut - more resources
Full Text Sources
Medical