. 2011 May;178(5):2020-31.
doi: 10.1016/j.ajpath.2011.01.029.

Mitochondrial dysfunction mediates aldosterone-induced podocyte damage: a therapeutic target of PPARγ

Affiliations

Mitochondrial dysfunction mediates aldosterone-induced podocyte damage: a therapeutic target of PPARγ

Chunhua Zhu et al. Am J Pathol. 2011 May.

Abstract

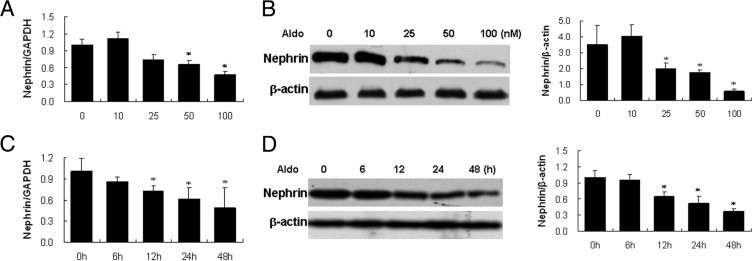
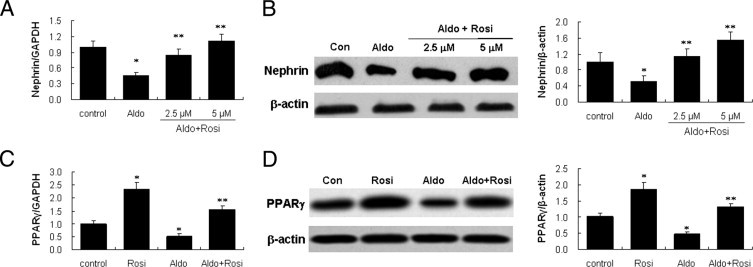
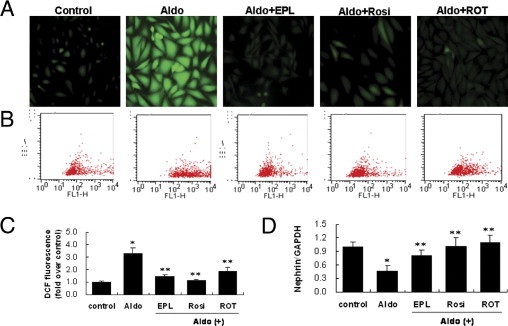
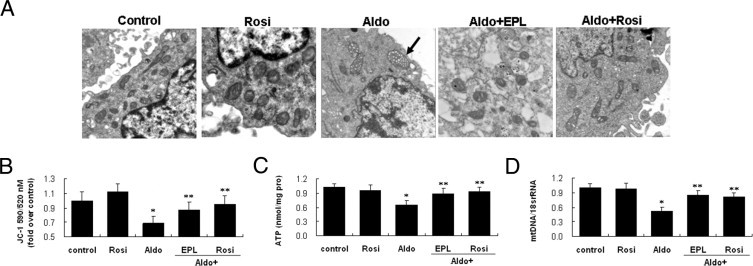
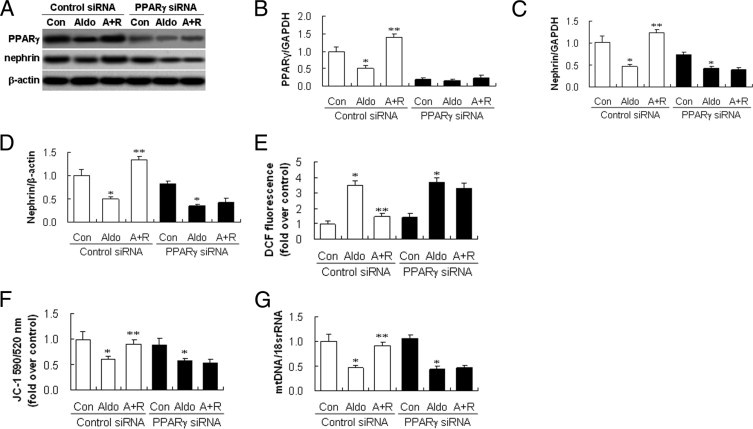
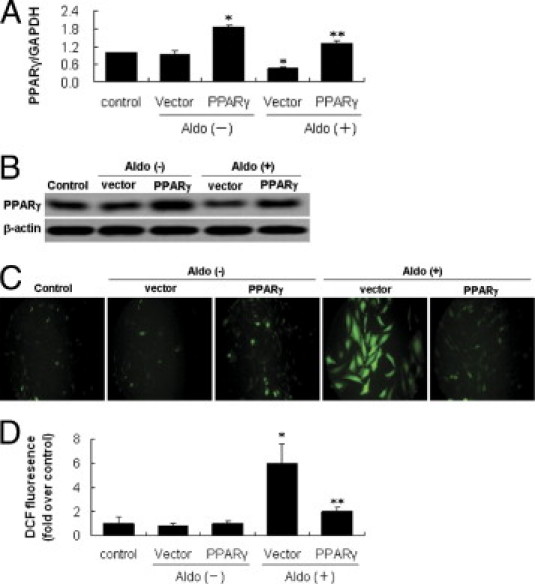
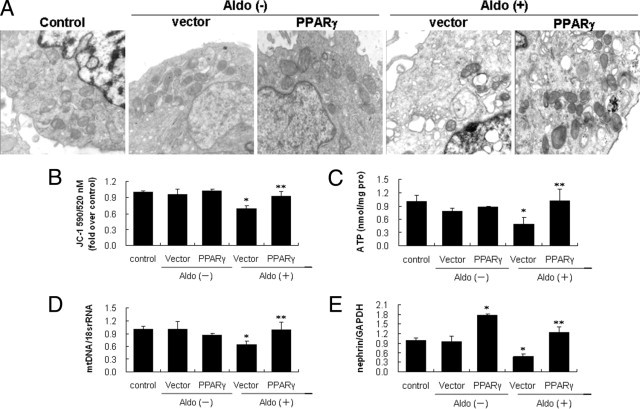
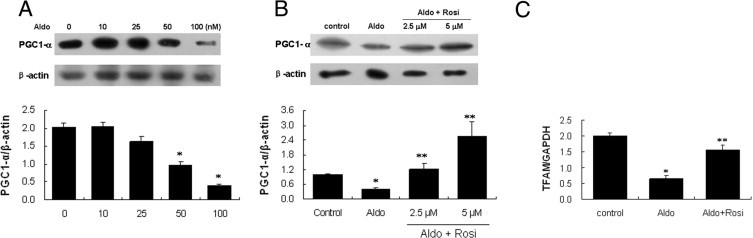
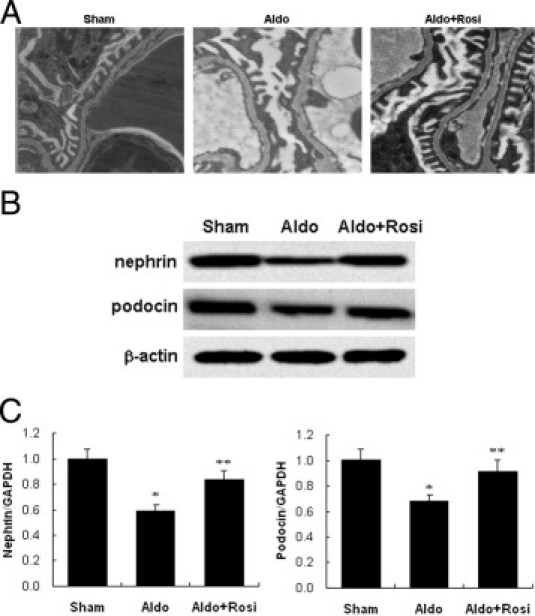
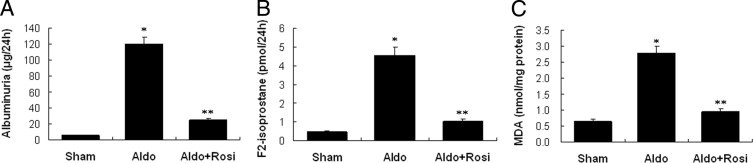
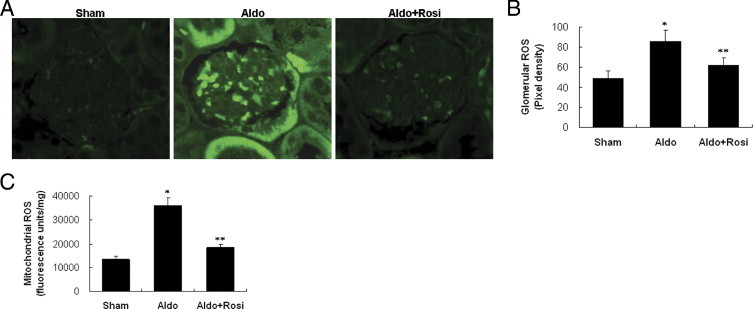
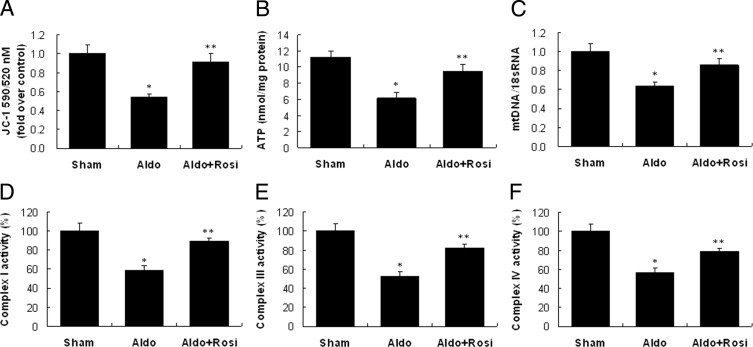
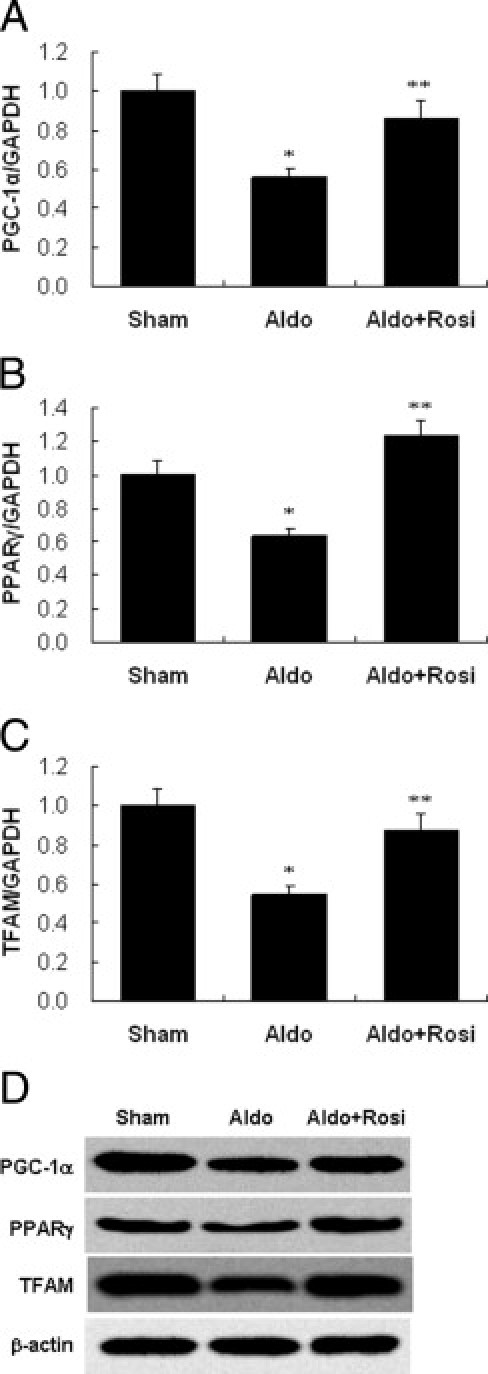
Aldosterone (Aldo) causes podocyte damage by an unknown mechanism. We examined the role of mitochondrial dysfunction (MtD) in Aldo-treated podocytes in vitro and in vivo. Exposure of podocytes to Aldo reduced nephrin expression dose dependently, accompanied by increased production of reactive oxygen species (ROS). The ROS generation and podocyte damage were abolished by the mitochondrial (mt) respiratory chain complex I inhibitor rotenone. Pronounced MtD, including reduced mt membrane potential, ATP levels, and mtDNA copy number were seen in Aldo-treated podocytes and in the glomeruli of Aldo-infused mice. The mineralocorticoid receptor antagonist eplerenone significantly inhibited Aldo-induced MtD. The MtD was associated with higher levels of ROS, reduction in the activity of complexes I, III, and IV, and expression of the peroxisome proliferator-activated receptor-γ (PPARγ) coactivator-1α and mt transcription factor A. Both the PPARγ agonist rosiglitazone and PPARγ overexpression protected against podocyte injury by preventing MtD and oxidative stress, as evidenced by reduced ROS production, by maintenance of mt morphology, by restoration of mtDNA copy number, by decrease in mt membrane potential loss, and by recovery of mt electron transport function. The protective effect of rosiglitazone was abrogated by the specific PPARγ small interference RNA, but not a control small interference RNA. We conclude that MtD is involved in Aldo-induced podocyte injury, and that the PPARγ agonist rosiglitazone may protect podocytes from this injury by improving mitochondrial function.


Figures

Figure 1
Figure 1
Effect of aldosterone (Aldo) on nephrin expression in podocytes. (A, B). Podocytes were treated with the indicated doses of Aldo for 48 hours, and nephrin mRNA and protein expression were detected by real-time RT-PCR (A), and immunoblot (B). (C, D) Podocytes were treated with 100 nmol/L Aldo for the indicated times. Nephrin mRNA and protein expression were detected by real time RT-PCR (C) and immunoblotting (D). (B, D) Left panel: representative immunoblots; right panel: densitometric analysis. Values represent mean ± SEM; n = 6. *P < 0.01 versus control by the analysis of variance test. GAPDH, glyceraldehyde-3-phosphate dehydrogenase.
Figure 2
Figure 2
Effect of rosiglitazone on nephrin and peroxisome proliferator-activated receptor (PPAR)-γ expression in podocytes. (A, B) Podocytes were pretreated with rosiglitazone (Rosi) (2.5, 5 μmol/L) for 30 minutes, followed by aldosterone (Aldo) (100 nmol/L) for 48 hours, and nephrin mRNA and protein were detected by real-time RT-PCR (A) and immunoblot (B). (C, D) Podocytes were pretreated with Rosi (5 μmol/L) for 30 minutes, followed by Aldo (100 nmol/L) for 48 hours, and PPARγ mRNA and protein were detected by real-time RT-PCR (C) and immunoblot (D). (B, D) Left panel: representative immunoblots; right panel: densitometric analysis. Data are mean ± SEM; n = 6. *P < 0.01 versus control; **P < 0.01 versus Aldo-treated group by analysis of variance.
Figure 3
Figure 3
Aldosterone (Aldo)-induced reactive oxygen species (ROS) production and its origin in podocytes. A: Podocytes in chamber slides were pretreated with eplerenone (EPL) (10 μmol/L), rosiglitazone (Rosi) (5 μmol/L), or rotenone (ROT) (10 μmol/L) for 30 minutes, and were then exposed to Aldo (100 nmol/L) for 60 minutes in the presence of 2′,7′-dichlorofluorescein (DCF) diacetate. B, C: Quantitative analysis of ROS. Podocytes in 6-well plates were treated as above-mentioned and florescence was quantified by fluorescence-assisted cell sorting (FACS). D: Effect of ROS on nephrin expression. Podocytes were pretreated with EPL (10 μmol/L), rosiglitazone (Rosi) (5 μmol/L), or ROT (10 μmol/L) for 30 minutes, and were then exposed to Aldo (100 nmol/L) for 48 hours. Nephrin mRNA was determined by real time RT-PCR. Data are mean ± SEM; n = 8. *P < 0.01 versus control; **P < 0.01 versus Aldo-treated group by analysis of variance.
Figure 4
Figure 4
Effect of eplerenone (EPL) and rosiglitazone (Rosi) on aldosterone (Aldo)-induced mitochondrial damage in podocytes. The podocytes were treated with Aldo (100 μmol/L) for 12 hours in the presence or absence of EPL (10 μmol/L) or Rosi (5 μmol/L). Mitochondrial (mt) ultrastructure, mitochondrial membrane potential (MMP), ATP content, and mtDNA copy number were determined (see Materials and Methods). A: Mt morphological changes. The mt superstructure was detected by transmission electron micrograph. Arrow indicates mt vacuolization (×30,000). B: MMP. C: ATP production. D: mtDNA copy number. Data are mean ± SEM; n = 8. *P < 0.01 versus control; **P < 0.01 versus Aldo-treated group by analysis of variance.
Figure 5
Figure 5
Rosiglitazone protects podocyte and restores mitochondrial function in a peroxisome proliferator-activated receptor (PPAR)-γ dependent manner. Podocytes transfected with PPARγ or control small interference RNA (siRNA) were treated with rosiglitazone and subjected to aldosterone (Aldo). Nephrin mRNA and proteins, and PPARγ proteins, were analyzed by real time RT-PCR and immunoblotting, respectively. ROS production, mitochondrial membrane potential, and mitochondrial (mt)DNA copy number in podocytes were detected (see Materials and Methods). A: Representative blot of PPARγ and nephrin. B: Densitometric analysis of PPAR-γ protein. C: Nephrin mRNA analysis. D: Densitometric analysis of nephrin protein. E: Quantitative analysis of ROS. F: MMP. G: mtDNA copy number. Data are mean ± SEM; n = 6. *P < 0.01 versus control; **P < 0.01 versus Aldo-treated group by analysis of variance. A+R, infected with siRNA and treated with Rosi and Aldo; Con, only control siRNA or PPARγ siRNA; DCF, 2′,7′-dichlorofluorescein; GAPDH, glyceraldehyde-3-phosphate dehydrogenase.
Figure 6
Figure 6
Effect of peroxisome proliferator-activated receptor (PPAR)-γ overexpression on aldosterone (Aldo)-induced reactive oxygen species (ROS) production in podocytes. A, B: PPAR-γ expression in pcDNA3.1-PPAR-γ transfected podocytes. The podocytes were transfected with pcDNA3.1-PPAR-γ (PPAR-γ) or empty vector (vector), with untreated cells used as the control. A: Real-time RT-PCR analysis of PPAR-γ mRNA expression. B: Immunoblot of PPAR-γ protein expression. C: Podocytes in chamber slides were transfected with pcDNA3.1-PPAR-γ, and then exposed to Aldo (100 nmol/L) for 60 minutes in the presence of 2′,7′-dichlorofluorescein diacetate. D: Quantitative analysis of ROS. Data are mean ± SEM; n = 8. *P < 0.01 versus control and empty vector; **P < 0.01 versus vector plus Aldo group by analysis of variance.
Figure 7
Figure 7
Effect of peroxisome proliferator-activated receptor (PPAR)-γ overexpression on aldosterone (Aldo)-induced mitochondrial (mt) damage and podocyte injury. The podocytes were transfected with vector or pcDNA3.1-PPAR-γ and exposed to Aldo (100 nmol/L) for an additional 12 hours. Mt ultrastructure, mitochondrial membrane potential, ATP content, mtDNA copy number, and nephrin mRNA expression were determined (see Materials and Methods). A: Mt morphological changes (×30,000). B: Mitochondrial membrane potential. C: ATP production. D: mtDNA copy number. E: Nephrin mRNA expression. Data are mean ± SEM; n = 8. *P < 0.01 versus control and empty vector; **P < 0.01 versus vector plus Aldo group by analysis of variance. GAPDH, glyceraldehyde-3-phosphate dehydrogenase.
Figure 8
Figure 8
Effects of rosiglitazone (Rosi) on peroxisome proliferator activated receptor gamma coactivator (PGC)-1α, and PGC-1α-dependent mitochondrial transcription factor A (TFAM) expression. A: Podocytes were treated with aldosterone (Aldo) as indicated for 24 hours, and PGC-1α expression was determined by immunoblotting. B: Podocytes were pretreated with Rosi (2.5, 5 μmol/L) for 30 minutes followed by aldosterone (Aldo) (100 nmol/L) for 24 hours, and PGC-1α expression was determined by immunoblotting. A, B: Upper panel: representative immunoblots; lower panel: densitometric analysis. C: Podocytes were treated with Aldo (100 μmol/L) for 12 hours in the presence or absence of Rosi (5 μmol/L). TFAM mRNA expression was detected by real time RT-PCR. Data are mean ± SEM; n = 6. *P < 0.01 versus control; **P < 0.01 versus Aldo-treated group by analysis of variance. GAPDH, glyceraldehyde-3-phosphate dehydrogenase.
Figure 9
Figure 9
Effects of rosiglitazone (Rosi) on podocyte injury in mice. A: Morphology changes of podocyte foot processes by electron microscopy (×12,000). B: Cortex nephrin and podocin protein expression by immunoblot. C: Cortex nephrin and podocin mRNA expression by real-time RT-PCR. Data are mean ± SEM; n = 8. *P < 0.05 versus sham group; **P < 0.05 versus the aldosterone (Aldo)-treated group by analysis of variance. GAPDH, glyceraldehyde-3-phosphate dehydrogenase.
Figure 10
Figure 10
Effects of rosiglitazone (Rosi) on albuminuria, urinary F2-isoprostane excretion, and kidney malondialdehyde (MDA) content in mice. A: Albuminuria. B: Urinary F2-isoprostane. C: Kidney cortex MDA. Data are mean ± SEM; n = 8. *P < 0.01 versus sham group; **P < 0.01 versus aldosterone (Aldo)-treated group by analysis of variance.
Figure 11
Figure 11
Effect of rosiglitazone (Rosi) on kidney ROS production. A: Representative 2′,7′-dichlorofluorescein (DCF) staining of hydrogen peroxide in the kidney (×400). B: Quantification of the pixel density of DCF stainings in glomeruli. C: Kidney mitochondrial levels of reactive oxygen species (ROS). Data are mean ± SEM; n = 8. *P < 0.01 versus sham group; **P < 0.01 versus aldosterone (Aldo)-treated group by analysis of variance.
Figure 12
Figure 12
Effect of rosiglitazone (Rosi) on mitochondrial (mt) function in the kidney. A: Mitochondrial membrane potential. B: ATP content. C: mtDNA copy number. D: Mt complex I activity. E: Mt complex III activity. F: Mt complex I activity. Data are mean ± SEM; n = 8. *P < 0.01 versus sham group; **P < 0.01 versus Aldo-treated group by analysis of variance.
Figure 13
Figure 13
Effect of rosiglitazone (Rosi) on peroxisome proliferator activated receptor gamma coactivator (PGC)-1α, peroxisome proliferator-activated receptor (PPAR)-γ, and mitochondrial transcription factor A (TFAM) expression in the kidney. PGC-1α (A), PPAR-γ (B), and TFAM (C) mRNA expression was examined by real-time RT-PCR. D: Representative immunoblot of PGC-1α, PPAR-γ, and TFAM in the cortex. Data are mean ± SEM; n = 8. *P < 0.01 versus sham group; **P < 0.01 versus Aldo-treated group by analysis of variance. GAPDH, glyceraldehyde-3-phosphate dehydrogenase.

References

    1. Greene E.L., Kren S., Hostetter T.H. Role of aldosterone in the remnant kidney model in the rat. J Clin Invest. 1996;98:1063–1068. - PMC - PubMed
    1. Epstein M. Aldosterone as a mediator of progressive renal disease: pathogenetic and clinical implications. Am J Kidney Dis. 2001;37:677–688. - PubMed
    1. Shibata S., Nagase M., Yoshida S., Kawachi H., Fujita T. Podocyte as the target for aldosterone: roles of oxidative stress and Sgk1. Hypertension. 2007;49:355–364. - PubMed
    1. Kiyomoto H., Rafiq K., Mostofa M., Nishiyama A. Possible underlying mechanisms responsible for aldosterone and mineralocorticoid receptor-dependent renal injury. J Pharmacol Sci. 2008;108:399–405. - PubMed
    1. Epstein M. Aldosterone blockade: an emerging strategy for abrogating progressive renal disease. Am J Med. 2006;119:912–919. - PubMed

Publication types

MeSH terms