. 2011 May;178(5):2286-98.
doi: 10.1016/j.ajpath.2011.01.052.

Observations in APP bitransgenic mice suggest that diffuse and compact plaques form via independent processes in Alzheimer's disease

Affiliations

Observations in APP bitransgenic mice suggest that diffuse and compact plaques form via independent processes in Alzheimer's disease

Anna Lord et al. Am J Pathol. 2011 May.

Abstract

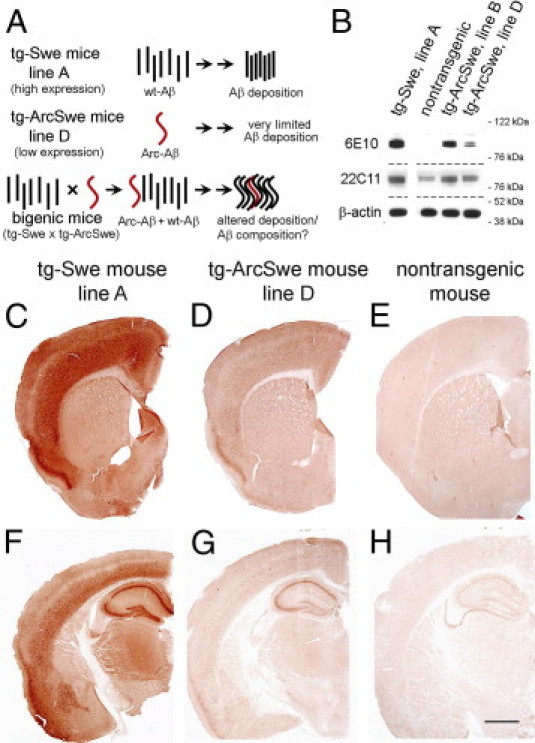
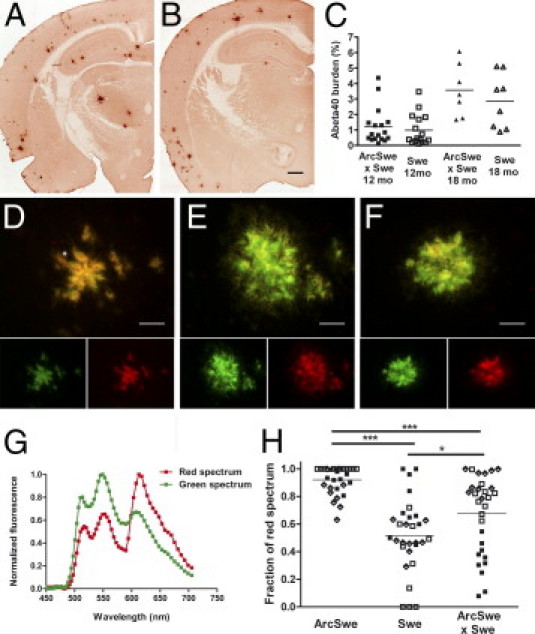
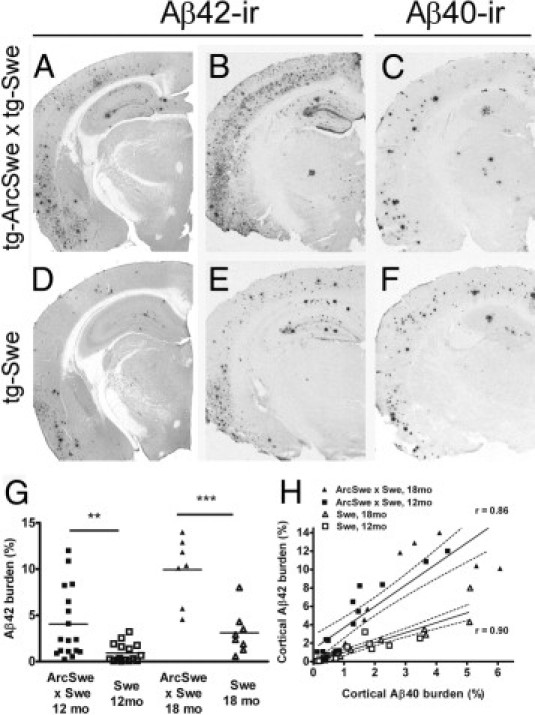
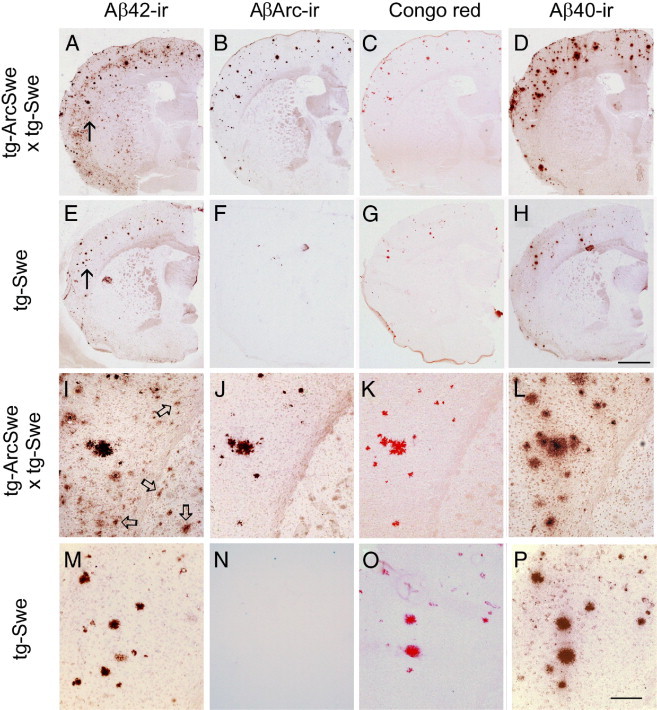
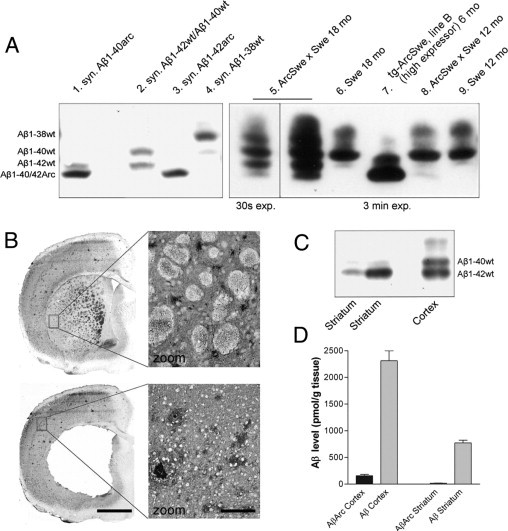
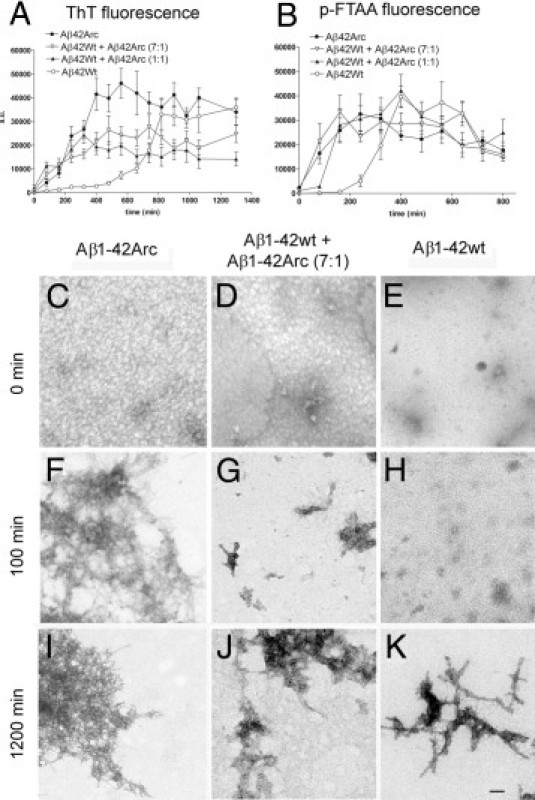
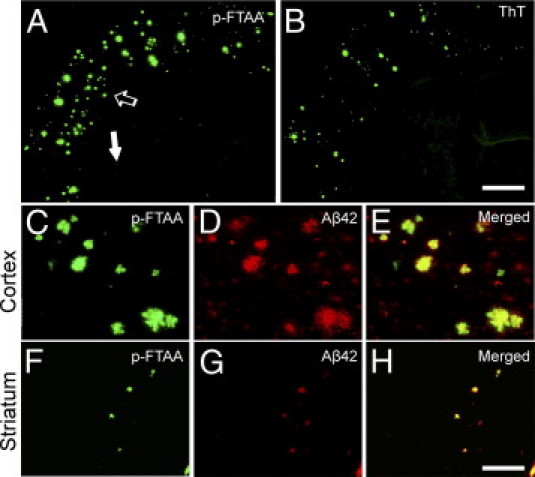
Studies of familial Alzheimer's disease suggest that misfolding and aggregation of amyloid-β (Aβ) peptides initiate the pathogenesis. The Arctic mutation of Aβ precursor protein (APP) results in AD, and Arctic Aβ is more prone to form Aβ protofibrils and extracellular deposits. Herein is demonstrated that the burden of diffuse Aβ deposits but not compact plaques is increased when tg-Swe mice are crossed with tg-ArcSwe mice synthesizing low levels of Arctic Aβ. The diffuse deposits in bitransgenic mice, which contain primarily wild-type Aβ42, accumulate in regions both with and without transgene expression. However, APP processing, when compared with tg-Swe, remains unchanged in young bitransgenic mice, whereas wild-type Aβ42 aggregation is accelerated and fibril architecture is altered in vitro and in vivo when a low level of Arctic Aβ42 is introduced. Thus, the increased number of diffuse deposits is likely due to physical interactions between Arctic Aβ and wild-type Aβ42. The selective increase of a single type of parenchymal Aβ deposit suggests that different pathways lead to formation of diffuse and compact plaques. These findings could have general implications for Alzheimer's disease pathogenesis and particular relevance to patients heterozygous for the Arctic APP mutation. Moreover, it further illustrates how Aβ neuropathologic features can be manipulated in vivo by mechanisms similar to those originally conceptualized in prion research.


Figures

Figure 1
Figure 1
High-level APP-expressing tg-Swe mice (line A) produced seven times more human APP than did tg-ArcSwe mice (line D). A: Experimental design of the study is schematically illustrated. B: APP protein synthesis of transgenic models, tg-Swe (line A), and nontransgenic mice, tg-ArcSwe (lines B and D), was analyzed using Western blot analysis and antibodies 6E10 (human APP), 22C11 (human plus endogenous APP), and β-actin. Anatomical distribution of human APP detected with 6E10-immunostaining in 2-month-old tg-Swe, line A (C and F), low-expressing founder line of tg-ArcSwe, line D (D and G), and a nontransgenic mouse (E and H). Scale bars = 1 mm.
Figure 2
Figure 2
AβArc did not change Aβ40 burden but influenced p-FTAA fluorescence of individual compact plaques in bitransgenic mice. Representative 12-month-old bitransgenic (A) and singly tg-Swe (B) mice. C: There was no statistically significant difference in cortical Aβ40-burden between 12- and 18-month-old bitransgenic and singly tg-Swe mice. Fluorescence images of p-FTAA bound to compact plaques and excited at 470 and 546 nm. Images illustrate a variation in p-FTAA emission spectrum between compact plaques found in tg-ArcSwe, line B (D), singly tg-Swe (E), and bitransgenic mice (F), respectively. The resulting emission when the excitation wavelengths (470 and 546 nm) are separated into two channels is shown below. Spectral unmixing of p-FTAA emission when bound to compact plaques in bitransgenic mice revealed a shift toward that of compact plaques in tg-ArcSwe compared with singly tg-Swe. G and H, Fraction of red spectrum of 10 individual plaques from three animals in each group (filled and open boxes and diamonds). Scale bars: 500 μm (B); 30 μm (DF).
Figure 3
Figure 3
AβArc favored an increased Aβ42-burden in bitransgenic mice. Aβ burden in the cerebral cortex of 12-month-old (A and D) and 18-month-old (B, C, E, and F) bitransgenic (AC) and singly tg-Swe (DF) mice. Aβ42 burden in representative 12-month-old (A) and 18-month-old (B) bitransgenic mice and in 12-month-old (D) and 18-month-old (E) tg-Swe. Aβ40 burden is shown from semiadjacent sections of 18-month-old bitransgenic (C) and tg-Swe (F) mice. G: Aβ42 burden was investigated in all animals using quantitative image analysis. H: There was a linear correlation between Aβ40 burden and Aβ42 burden among individuals within the experimental groups, but a substantial difference between bitransgenic and singly tg-Swe mice. Scale bar = 900 μm.
Figure 4
Figure 4
Increased Aβ42 burden in bitransgenic mice was due to diffuse deposits that were not recognized by an antibody specific for AβArc. Aβ-deposition in 18-month-old bitransgenic (A–D and IL) and singly tg-Swe mice (EH and MP). Adjacent sections (10 μm) were immunostained with Aβ42-specific antibody (A, E, I, and M), AβArc-specific antibody (B, F, J, and N), Congo red (C, G, K, and O), and Aβ40-specific antibody (D, H, L, and P). Arrows in A and E indicate areas shown at higher magnification (I and M, respectively), and arrows in I indicate some diffuse Aβ42-immunoreactive deposits. Scale bars: 1 mm (A–H); 200 μm (I–P). The spots in (F) are unspecific staining that are due to slight damage to parts of this tissue section.
Figure 5
Figure 5
AβArc led to increased accumulation of Aβ42wt and more diffuse deposits in the striatum in bitransgenic mice. Urea/SDS-PAGE and Western blot analysis (with 6E10 antibody) of extracts of 70% formic acid (total Aβ) of plaque-bearing bitransgenic and tg-Swe mice at ages 12 and 18 months. A: For comparison, tissue from a 6-month-old tg-ArcSwe (line B; high-expressor line) with plaques and synthetic Aβ peptides were included in the experiments. B: Immunostaining of a brain section from an 18-month-old bitransgenic mouse with an Aβ42-specific antibody before and after the striatum (caudate putamen) had been dissected. Extracts of 70% formic acid from dissected striatum (caudate putamen) and cerebral cortex layers I to VI in an 18-month-old bitransgenic mouse at the level of the frontal cortex (bregma 1.0 mm to −0.1 mm). C: Localization of Aβ peptides differed markedly, and Aβ1-42wt was the predominant Aβ peptide in the striatum, whereas both Aβ1-40wt and Aβ1-42wt were abundant in the cerebral cortex. D: Further analyses of the same formic acid extracts of dissected tissues at ELISA (pmol/g tissue) demonstrated that AβArc was present but represented only a small fraction of total Aβ in both cerebral cortex and striatum (n = 4). Scale bars: 1 mm (B); 100 μm in enlarged images.
Figure 6
Figure 6
A mixture of AβArc and Aβwt accelerated prefibrillar Aβ aggregate formation in vitro. Aggregation of recombinant Aβ1–42 was monitored with ThT (A) and p-FTAA (B). Fibrillation kinetics of Aβ1-42wt (open circles; 20 μmol/L), Aβ1-42wt and Aβ1-42Arc in a ratio of 7:1 (open triangles; 20 μmol/L total Aβ), Aβ1-42wt and Aβ1-42Arc in a ratio of 1:1 (solid triangles; 20 μmol/L total Aβ), and Aβ1-42Arc (solid circles; 20 μmol/L). p-FTAA detects early events in the aggregation process. With both probes, the lag phase was shorter when AβArc was present. Each symbol represents the mean (SEM) of two or three experiments. Ultrastructural analysis of Aβ aggregates at electron microscopy. Samples of Aβ1-42Arc (20 μmol/L; C, F, and I), Aβ1-42wt and Aβ1-42Arc at a ratio of 7:1 (20 μmol/L total Aβ; D, G, and J), and Aβ1-42wt (20 μmol/L; E, H, and K) were analyzed at 0 minutes (CE), 100 minutes (FH), and 1200 minutes (IK). Scale bars: 100 nm (CK).
Figure 7
Figure 7
Diffuse Aβ deposits in bitransgenic mice were stained using p-FTAA. Tissue sections 25 μm thick from a bitransgenic mouse were fixed in paraformaldehyde and stained with an Aβ42-specific antibody together with either p-FTAA (A) or ThT (B). The area at the tip of the open arrow in A is magnified (CE), and the area at the tip of the solid arrow in B is enlarged (FH). Both dyes enabled visualization of compact plaques, and p-FTAA also stained numerous diffuse Aβ deposits (FH). Scale bars: 1 mm (A and B); 100 μm (CH).

References

    1. Hardy J. A hundred years of Alzheimer's disease research. Neuron. 2006;52:3–13. - PubMed
    1. Basun H., Bogdanovic N., Ingelsson M., Almkvist O., Näslund J., Axelman K., Bird T.D., Nochlin D., Schellenberg G.D., Wahlund L.O., Lannfelt L. Clinical and neuropathological features of the Arctic APP gene mutation causing early-onset Alzheimer disease. Arch Neurol. 2008;65:499–505. - PMC - PubMed
    1. Nilsberth C., Westlind-Danielsson A., Eckman C.B., Condron M.M., Axelman K., Forsell C., Stenh C., Luthman J., Teplow D.B., Younkin S.G., Näslund J., Lannfelt L. The “Arctic” APP mutation (E693G) causes Alzheimer's disease by enhanced Abeta protofibril formation. Nat Neurosci. 2001;4:887–893. - PubMed
    1. Johansson A.S., Berglind-Dehlin F., Karlsson G., Edwards K., Gellerfors P., Lannfelt L. Physiochemical characterization of the Alzheimer's disease–related peptides A beta 1-42Arctic and A beta 1-42wt. FEBS J. 2006;273:2618–2630. - PubMed
    1. Lord A., Kalimo H., Eckman C., Zhang X.Q., Lannfelt L., Nilsson L.N. The Arctic Alzheimer mutation facilitates early intraneuronal Abeta aggregation and senile plaque formation in transgenic mice. Neurobiol Aging. 2006;27:67–77. - PubMed

Publication types

Substances