

Review
doi: 10.1016/j.jprot.2011.03.032.
Epub 2011 Apr 13.
Mass spectrometry imaging for drugs and metabolites
Affiliations
- PMID: 21515430
- PMCID: PMC3151478
- DOI: 10.1016/j.jprot.2011.03.032
Item in Clipboard
Review
Mass spectrometry imaging for drugs and metabolites
J Proteomics.
.
Abstract
Mass spectrometric imaging (MSI) is a powerful analytical technique that provides two- and three-dimensional spatial maps of multiple compounds in a single experiment. This technique has been routinely applied to protein, peptide, and lipid molecules with much less research reporting small molecule distributions, especially pharmaceutical drugs. This review's main focus is to provide readers with an up-to-date description of the substrates and compounds that have been analyzed for drug and metabolite composition using MSI technology. Additionally, ionization techniques, sample preparation, and instrumentation developments are discussed.
Copyright © 2011 Elsevier B.V. All rights reserved.
Figures
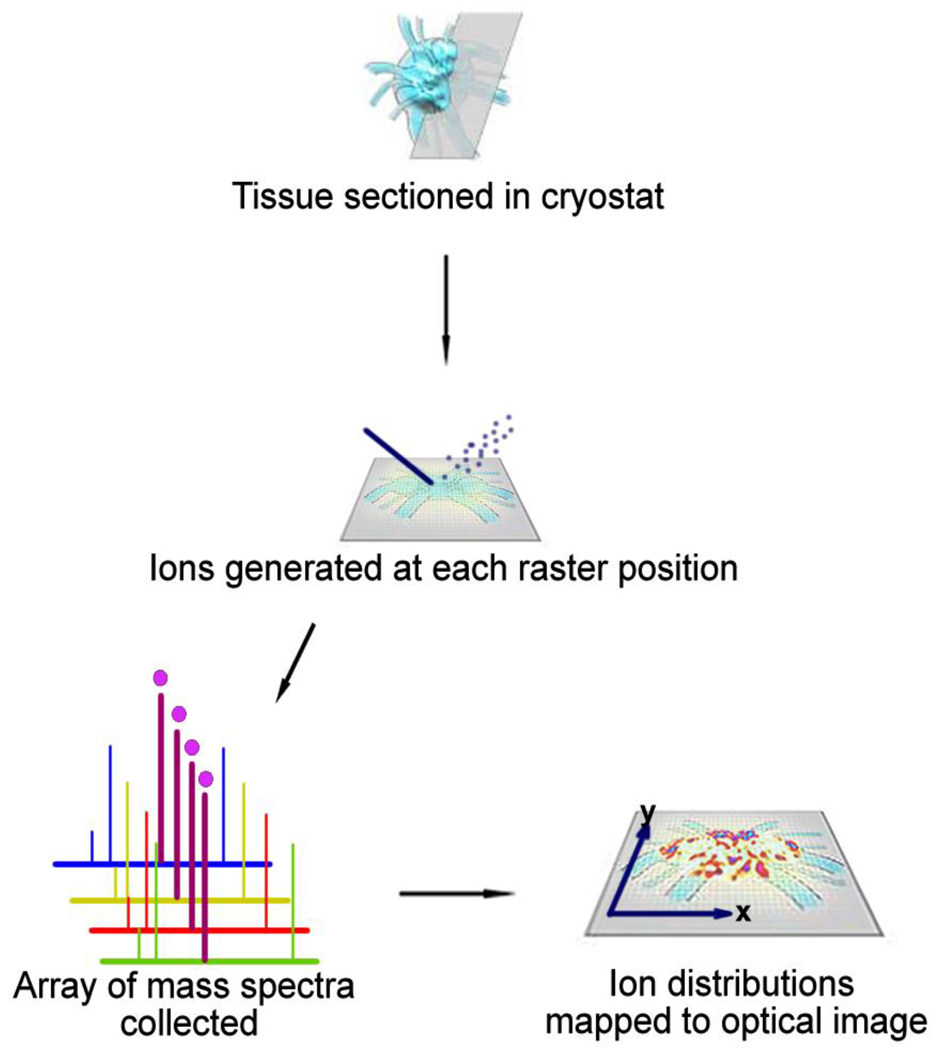
General scheme of mass spectrometry imaging technology. Acquisition occurs by collecting mass spectra for each pixel and processing this array into representative 2D images of specific m/z.
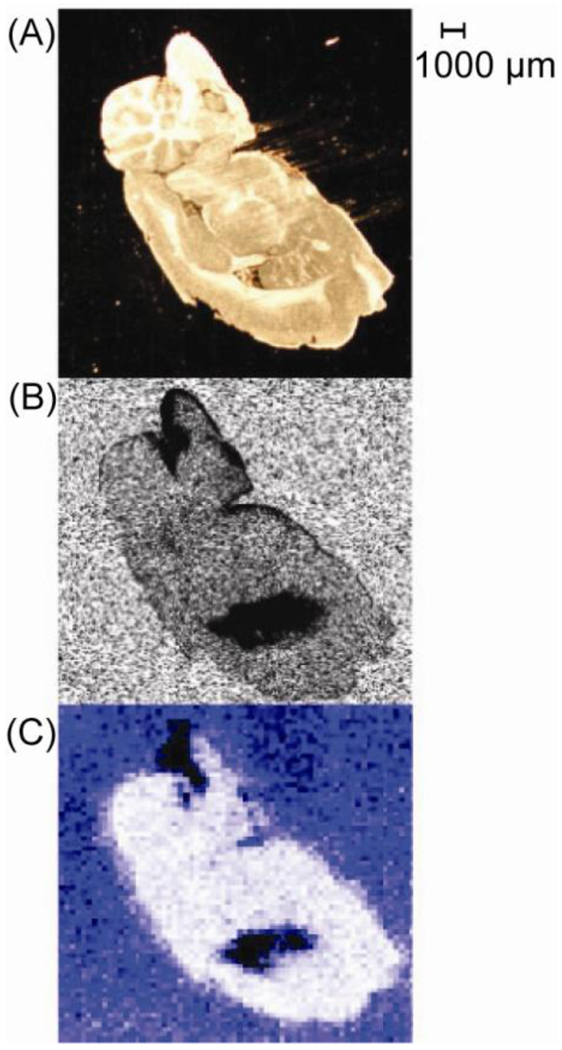
Distribution of clozapine in rat brain. (A) Optical image. (B) Autoradiography image. (C) MALDI MS/MS image. Adapted with permission from Ref. [24].
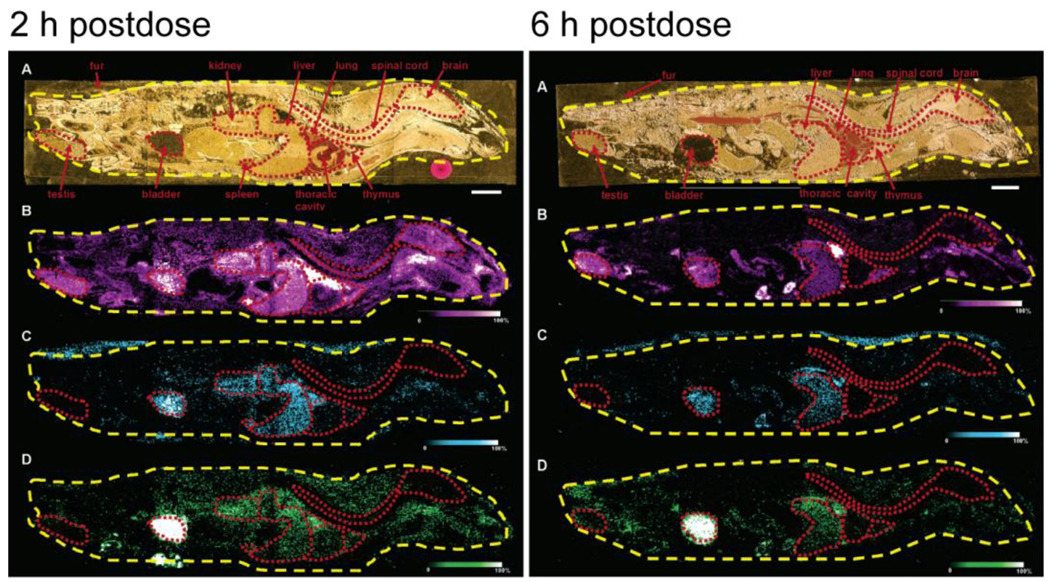
Detection of drug and metabolite distribution at 2 hr and 6 hr postdose in a whole rat sagittal tissue section by MALDI IMS. (A) Optical image of post OLZ dosed tissue section across four gold MALDI target plates. (B) Organs outlined in red. MS/MS ion image of OLZ (m/z 256). (C) MS/MS ion image of N-desmethyl metabolite (m/z 256). (D) MS/MS ion image of 2-hydroxymethyl metabolite (m/z 272). Bar, 1 cm. Adapted with permission from Ref. [25].
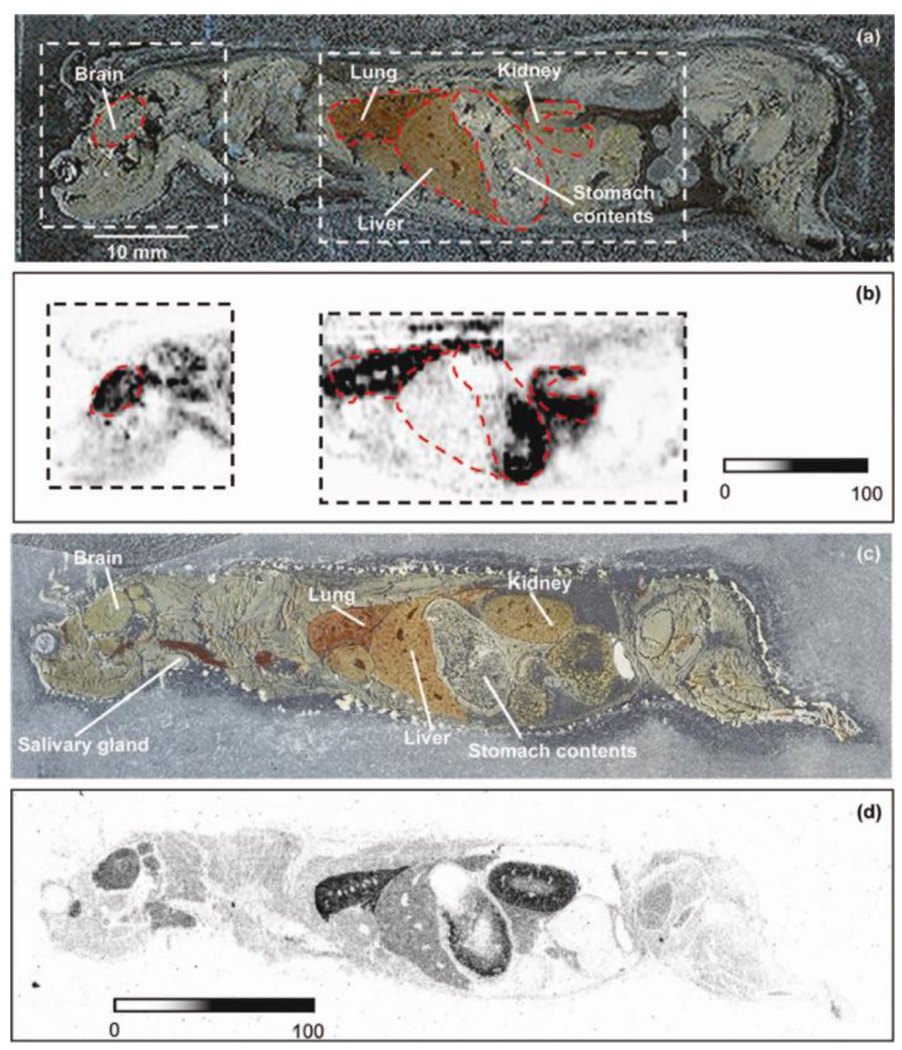
Detection of propranolol in whole mouse sagittal tissue by DESI-MS/MS. (a) Scanned optical image of a 40 µm thick sagittal whole-body tissue section of a mouse dosed intravenously with 7.5 mg/kg propranolol and euthanized 20 min after dose. (b) Distribution of propranolol in 20 mm × 20 mm and 38 mm × 20 mm areas measured by DESI-MS/MS (SRM: m/z 260 → 116) using 80/20 (v/v) methanol/water as DESI solvent at a flow rate of 5 µL/min. Surface scan rate was 0.1 mm/s, dwell time was 100 ms, and the images were created from 41 lanes with 500 µm spacing. Pixel size was 84 µm (h) × 500 µm (v), and experiment times were 150 and 285 min for the 20 mm × 20 mm and 38 mm × 20 mm areas, respectively. (c) Scanned optical image of a 40 µm thick sagittal whole-body tissue section of a mouse dosed intravenously with 7.5 mg/kg [3H]propranolol and euthanized 20 min after dose. (d) Autoradioluminograph of [3H]propranolol-related material in the tissue section presented in (c). Adapted with permission from Ref. [38].
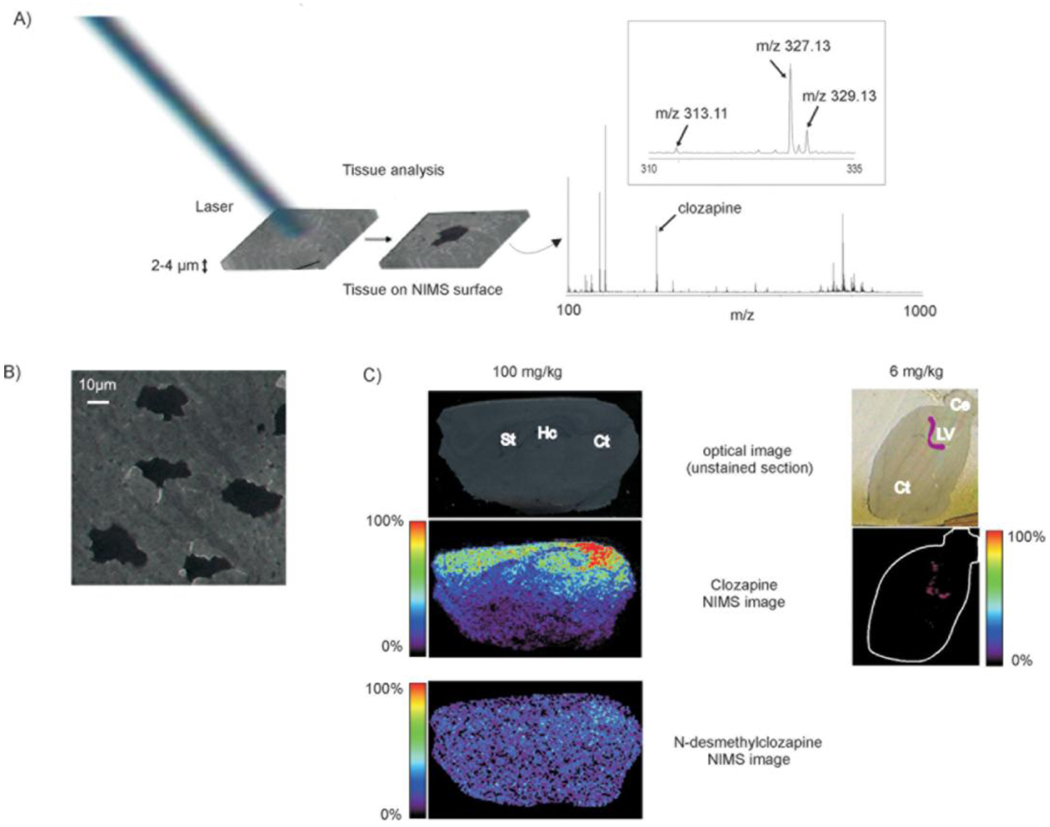
The concept of tissue imaging with laser-NIMS: (A) The tissue slice (2–4 µm thick sections) is placed directly on the NIMS surface and is subjected to laser irradiation (~0.1 J/cm2 pulse)) resulting in desorption/ionization of endogenous metabolites and xenobiotics. The full-MS mode mass spectrum shows the presence of intact clozapine (m/z 327.13) and N-desmethylclozapine (m/z 313.11) in the brain tissue. Inset shows the isotopic distribution of clozapine characterized by the chloride atom. (B) Nitrogen laser beam irradiation produces 15–20 µm diameter “etched” areas (black area). The photograph shows the sagittal unstained section of a mouse brain after MS acquisition on NIMS chip (scale bar: 10 µm). (C) Top, unstained sections of brain slices (sagittal) before NIMS analysis. Hc, hippocampus; St, striatum; Ce, cerebellum; LV, lateral ventricle; Ct, cortex. Middle, NIMS clozapine images (dose: 100 mg/kg rat and 6 mg/kg mouse). Bottom, NIMS N-desmethylclozapine image (dose: 100 mg/kg). For easy visualization, the purple mark in the unstained section (6 mg/kg) indicates clozapine localization by NIMS. In the NIMS image, the edge of the tissue has been also highlighted in white. Adapted with permission from Ref. [13].
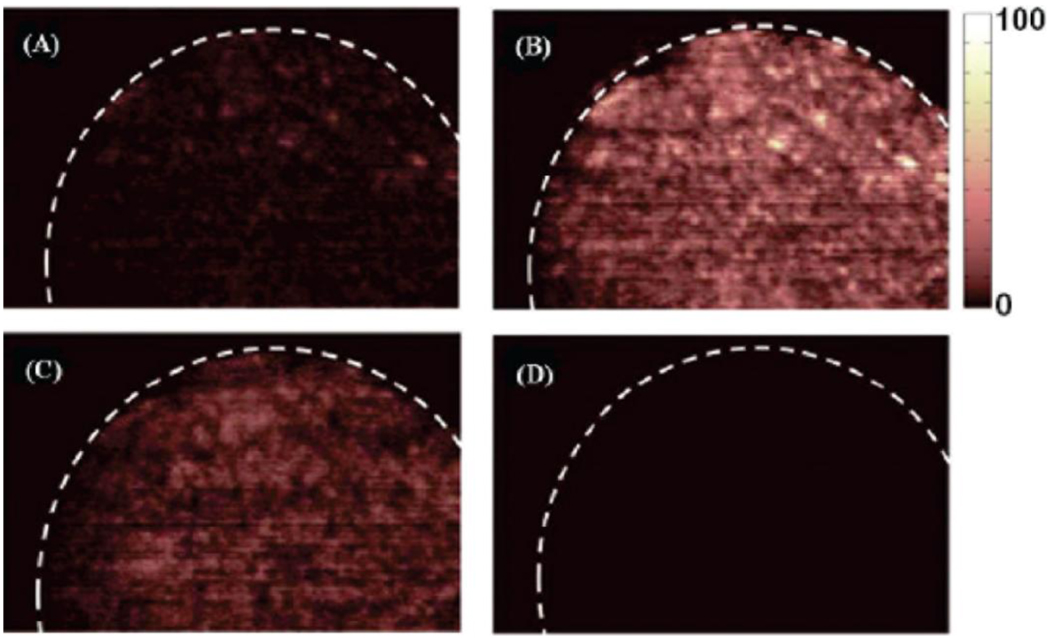
DESI MS images of a counterfeit artesunate sample: (A) sodiated acetaminophen (m/z 174.1), (B) sodiated acetaminophen dimer (m/z 325.1), (C) sodiated lactose (m/z 365.3), and (D) sodiated artesunic acid monomer (m/z 407.2). Adapted with permission from Ref. [58].
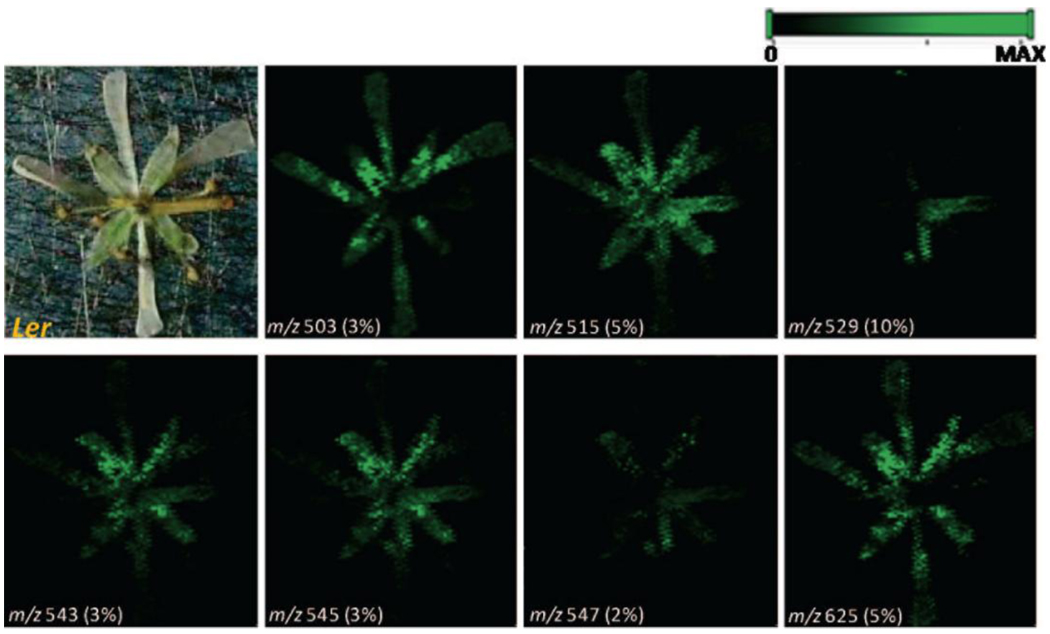
Chemically selective images of Arabidopsis wild-type (Ler) whole flowers. Major ions detected at m/z 529 correspond to [C29 ketone + 107Ag]+. Ions detected at m/z 515 and 543 are mainly silver adduct ions of C29 and C31 alkanes. Ions at m/z 547 are from C30 alcohol, and the image for the peak at m/z 545 corresponds to the overlapped image of C31 alkane and C30 alcohol as [C31 alkane + 109Ag]+ and [C30 alcohol + 107Ag]+. Images for silver adduct ions of C26 fatty acids (at m/z 503) and an unknown compound (at m/z 625) are also shown. Adapted with permission from Ref. [60].
References
-
- Hahn EJ. Autoradiography: a review of basic principles. Am Lab. 1983;15:64–71.
-
- Svatos A. Mass spectrometric imaging of small molecules. Trends Biotechnol. 2010;28:425–434. - PubMed
-
- Reyzer ML, Hsieh Y, Ng K, Korfmacher WA, Caprioli RM. Direct analysis of drug candidates in tissue by matrix-assisted laser desorption/ionization mass spectrometry. J Mass Spectrom. 2003;38:1081–1092. - PubMed
-
- Cohen LH, Gusev AI. Small molecule analysis by MALDI mass spectrometry. Anal Bioanal Chem. 2002;373:571–586. - PubMed
Publication types
MeSH terms
Substances
Grants and funding
LinkOut - more resources
Full Text Sources
Other Literature Sources
Medical
