. 2011 Jul;32(7):1013-24.
doi: 10.1093/carcin/bgr075. Epub 2011 Apr 23.

Mesothelin overexpression promotes autocrine IL-6/sIL-6R trans-signaling to stimulate pancreatic cancer cell proliferation

Affiliations

Mesothelin overexpression promotes autocrine IL-6/sIL-6R trans-signaling to stimulate pancreatic cancer cell proliferation

Uddalak Bharadwaj et al. Carcinogenesis. 2011 Jul.

Abstract

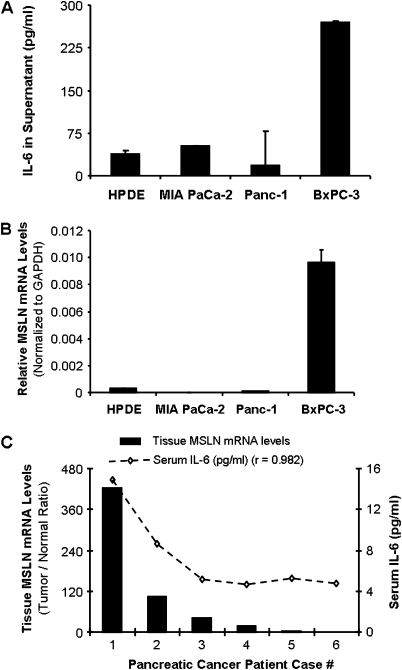
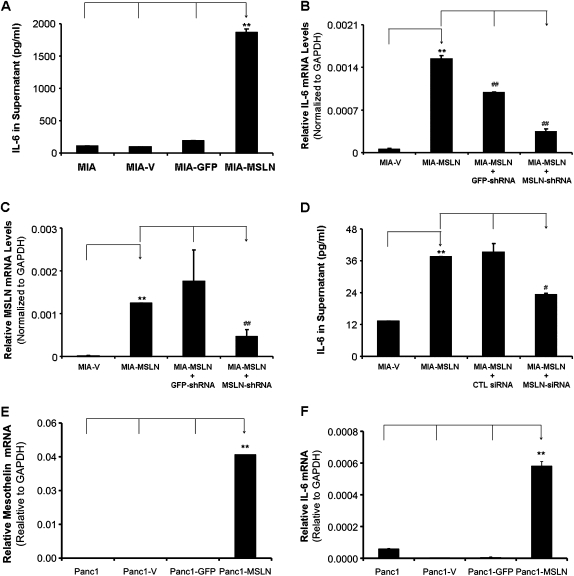
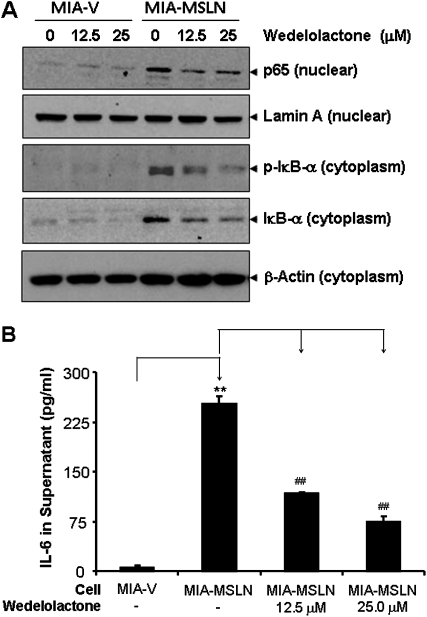
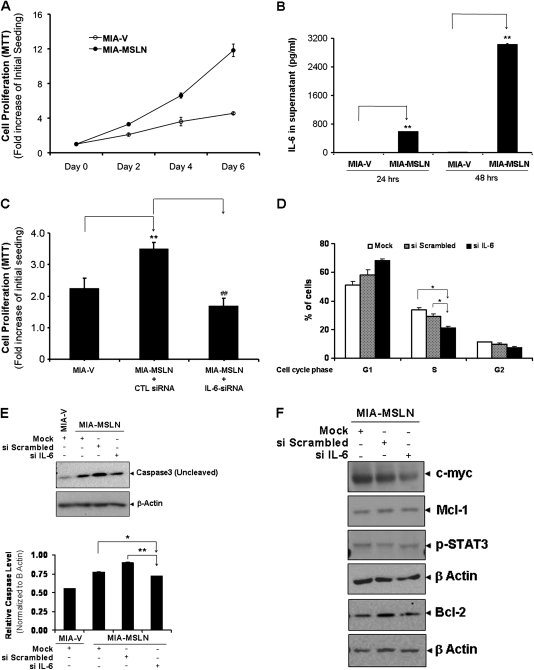
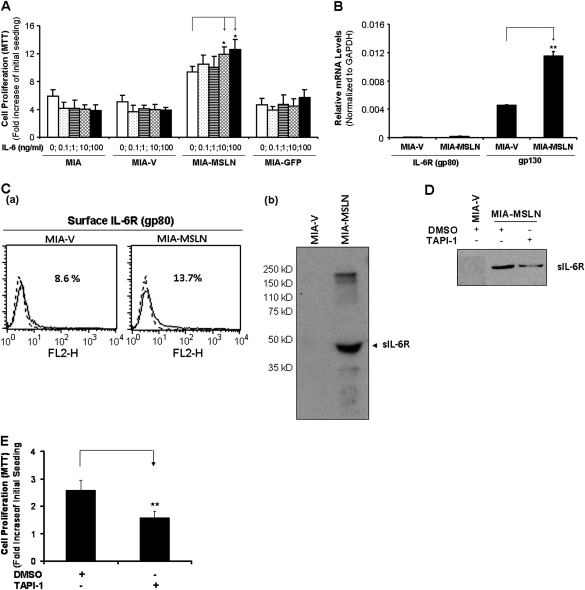
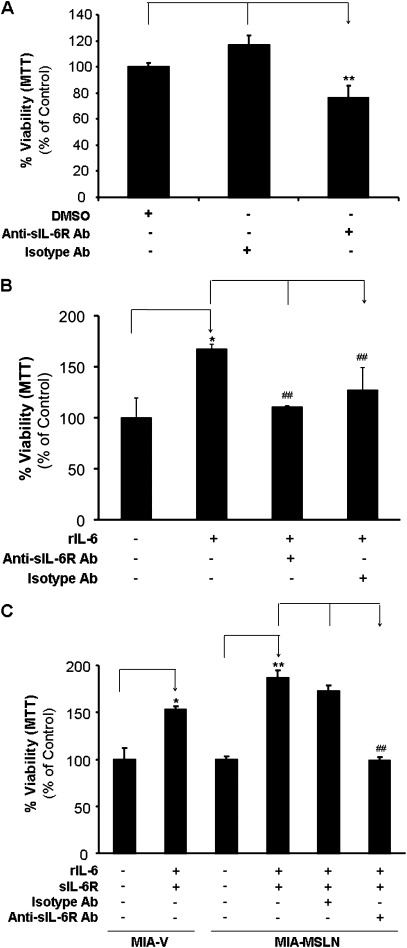
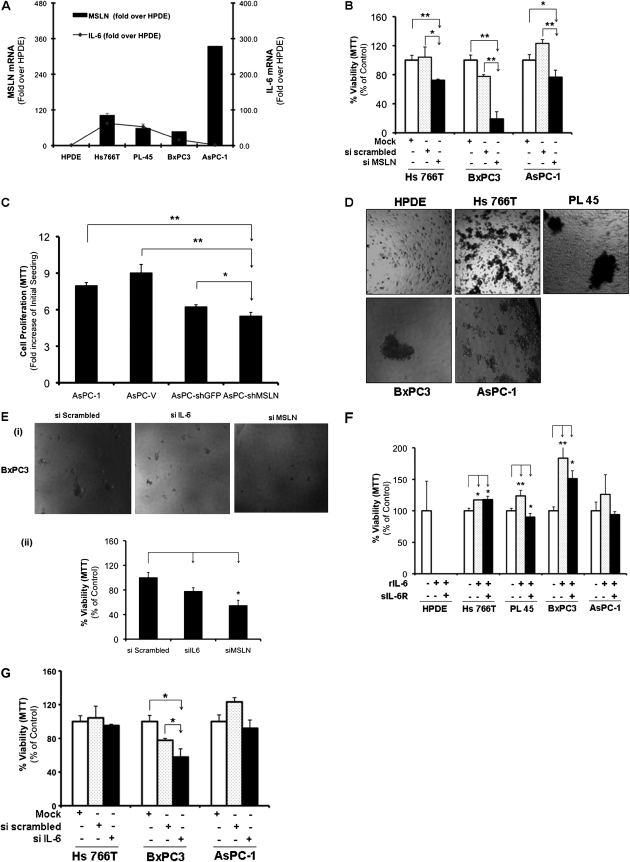
Mesothelin (MSLN) overexpression in pancreatic cancer (PC) leads to enhanced cell survival/proliferation and tumor progression. After screening for a number of growth factors/cytokines, we found that the MSLN expression correlated closely with interleukin (IL)-6 in human PC specimens and cell lines. Stably overexpressing MSLN in different PC cell lines (MIA-MSLN and Panc1-MSLN) led to higher IL-6 production. Silencing MSLN by small interfering RNA (siRNA) significantly reduced IL-6 levels. Blocking the observed constitutive activation of nuclear factor-kappaB (NF-κB) with IKK inhibitor wedelolactone in MIA-MSLN cells also reduced IL-6. Silencing IL-6 by siRNA reduced cell proliferation, cell cycle progression and induced apoptosis with significant decrease of c-myc/bcl-2. Interestingly, recombinant IL-6-induced proliferation of MIA-MSLN cells but not MIA-V cells. Although messenger RNA/protein levels of IL-6R did not vary, soluble IL-6R (sIL-6R) was significantly elevated in MIA-MSLN and was reduced by treatment with the TACE/ADAM17 inhibitor TAPI-1, indicating intramembrane IL-6R cleavage and IL-6 trans-signaling may be operative in MIA-MSLN cells. Blocking the IL-6/sIL-6R axis using sIL-6R antibody abrogated basal proliferation/survival as well as recombinant human IL-6-induced cell proliferation. Our data suggest that MSLN-activated NF-κB induces elevated IL-6 expression, which acts as a growth factor to support PC cell survival/proliferation through a novel auto/paracrine IL-6/sIL-6R trans-signaling. In addition, using a panel of PC cells with varying MSLN/IL-6 expressions, we showed that MSLN/IL-6 axis is a major survival axis in PC supporting tumor cell growth under anchorage-dependent and independent conditions. The close correlation between MSLN and IL-6 provides a new rationale for combination therapy for effective control of MSLN-overexpressing PCs.


Figures

Fig. 1.
Fig. 1.
MSLN expression level correlates well with IL-6 expression in PC cell lines and tissues. (A) IL-6 levels in PC cell lines MIA PaCa-2, Panc-1, BxPC-3 and HPDE cells. Cells were seeded at 1 × 10⁶ cells per well in six-well plates and cultured until 60% confluence. Thereafter, the medium was replaced and the supernatants were harvested at 48 h of further incubation and tested for IL-6 using the Luminex-based IL-6 assay kit. Values on Y-axis show the amount of IL-6 in pg/ml, bars denoting standard deviation (SD) of duplicate data. (B) Relative MSLN mRNA levels in PC cell lines MIA PaCa-2, Panc-1, BxPC-3 and HPDE cells. Total mRNA from the cell lines were reverse transcribed and tested for MSLN expression. The results depicted denote MSLN mRNA levels in each cell line normalized to the GAPDH mRNA level. Relative mRNA level is presented as 2 [Ct(GAPDH)−Ct(MSLN)] and is representative of at least two independent experiments. The bars denote SD of duplicate data. (C) Sera from six PC patients were tested for secreted IL-6 using Bioplex cytokine kit. Paired tumor and normal tissues (T/N) from the same patients were tested for the expression of MSLN mRNA by using real-time polymerase chain reaction and represented by the bar graph. The left hand side Y-axis denotes T/N ratio of the GAPDH-normalized MSLN mRNA levels. Line graph represents the serum IL-6 level in six patient samples and the right hand side Y-axis indicates IL-6 concentrations in pg/ml.
Fig. 2.
Fig. 2.
MSLN overexpression leads to increased IL-6 production in PC cells. (A). MIA, MIA-V, MIA-GFP and MIA-MSLN cells were seeded at 1 × 10⁶ cells per well in six-well plates and cultured until 60% confluence. Thereafter, the medium was replaced and the supernatants were harvested at 48 h of further incubation and the levels of IL-6 were determined by using the Luminex-based IL-6 assay kit. Y-axis represents IL-6 concentration in pg/ml. (B) Silencing MSLN using MSLN-specific shRNA plasmid. MIA-V and MIA-MSLN cells were transfected with MSLN-specific shRNA plasmids or GFP shRNA control plasmids. The cells collected 48 h posttransfection were used to detect MSLN mRNA by real-time polymerase chain reaction. The MSLN-expressing levels were detected by using real-time polymerase chain reaction. Y-axis represents MSLN mRNA level normalized to the GAPDH mRNA level. Relative mRNA level is presented as 2 [Ct(GAPDH)−Ct(IL-6)]. The bars denote SD of duplicate data. Experiment was performed several times using separate MIA-MSLN pools and different siRNA/shRNAs against MSLN with similar results. (C) Silencing MSLN decreases IL-6 mRNA production in MIA-MSLN cells. MIA-V and MIA-MSLN cells were transfected with MSLN-specific shRNA plasmids or GFP shRNA control plasmids. The cells collected 48 h posttransfection were used to detect IL-6 mRNA by real-time polymerase chain reaction. Y-axis represents IL-6 mRNA level relative to GAPDH. The bars denote SD of duplicate data. Experiment was performed several times using separate MIA-MSLN pools and different siRNA/shRNAs against MSLN with similar results. (D) Silencing MSLN decreases IL-6 secretion in MIA-MSLN cells. MIA-V and MIA-MSLN cells were transfected with MSLN-specific siRNA or scrambled siRNA. The cells collected 48 h posttransfection from 24-well plates in 2 ml of medium were used to detect IL-6 by Luminex-based IL-6 assay kit. Values on Y-axis show the amount of IL-6 in pg/ml, bars denoting SD of duplicate data. (E) Stable overexpression of MSLN in human PC cell Panc1. The GAPDH-normalized MSLN expression levels in the stably MSLN expressing (Panc1-MSLN) and control MIA cells generated by retroviral gene transfer and subsequent puromycin selection are shown. (F) Panc1, Panc1-V, Panc1-GFP and Panc1-MSLN cells were seeded at 1 × 10⁶ cells per well in six-well plates and cultured until 80% confluence, cells collected were used to detect IL-6 mRNA by real-time polymerase chain reaction. Y-axis represents IL-6 mRNA level relative to GAPDH. The bars denote SD of duplicate data. *, # denote P < 0.05, and **, ## denote P < 0.01, compared with controls, t-test. * and # denote comparison to different base lines and hence are denoted differently.
Fig. 3.
Fig. 3.
Blocking NF-κB activation in MIA-MSLN cells leads to decrease in IL-6 expression. (A) NF-κB activation in MIA-MSLN cells was blocked by IKK inhibitor wedelolactone. For the nuclear extract, 20 μg of nuclear total proteins from control MIA-V and MIA-MSLN cells treated with or without IKK inhibitor wedelolactone at the indicated concentrations for 24 h was subjected to immunoblot analysis with antibodies against p65 and lamin A. For the cytosolic proteins, 30 μg of cytoplasmic protein from the same cells were subjected to immunoblot for p-IκBα, IκBα and β-actin. Data from a representative blot is shown. (B) Blocking NF-κB activation by wedelolactone reduced IL-6 production in MIA-MSLN cells. At 48 h posttreatment with wedelolactone in MIA-V and MIA-MSLN cells at the indicated concentrations, the supernatants were collected and tested for IL-6 using the Luminex-based IL-6 assay kit. Values on Y-axis show the amount of IL-6 in pg/ml, bars denoting SD of duplicate data. *, # denote P < 0.05, and **, ## denote P < 0.01, compared with controls, t-test.
Fig. 4.
Fig. 4.
IL-6 is an autocrine growth and survival factor for the MIA-MSLN cells. (A) Overexpression of MSLN promotes PC cell proliferation in serum-free conditions. MIA-MSLN and control MIA-V cells were seeded in 96-well plates (2 × 10³ cells per well), serum starved (0% FBS) for 24 h before changing to fresh serum-free medium and cultured for 6 days. Viability was measured with MTT. Relative increase in viability was measured by dividing viability at a time point by viability of same cells at day 0 (day after plating) and is plotted along Y-axis. Data plotted show mean of triplicate wells. Proliferation after initial starvation followed by low serum supplementation was performed several times, serum-free survival was also performed multiple times, and data shown is a representative one. (B) Serum starvation increases IL-6 production by MIA-MSLN but not by MIA-V cells. MIA-V or MIA-MSLN cells (4 × 10⁶) were plated in T75 flasks and cultured till 90% confluent. Growth medium was then replaced by serum-free medium and supernatants were collected after 24 and 48 h and assayed for IL-6 using the Luminex-based IL-6 assay kit. Values on Y-axis show the amount of IL-6 in pg/ml, bars denoting SD of duplicate data. (C) IL-6 siRNA reduced MIA-MSLN cell proliferation. MIA-V and MIA-MSLN cells were transfected in six-well plates using a pool of four IL-6-specific siRNAs or a negative control pool of scrambled siRNAs. At 24 h after the transfection, cells were trypsinized, counted and seeded in 96-well plates (2 × 10³ cells per well), serum starved (0% FBS) for 24 h before changing to fresh medium with 0.2% FBS and cultured for 2 days. Viability was measured with MTT. Relative increase in viability was measured by dividing viability at a time point by viability of same cells at day 0 (day after plating) and is plotted along Y-axis. Data plotted show mean of triplicate wells. *, # denote P < 0.05, and **, ## denote P < 0.01, compared with controls, t-test. Experiment was performed several times using various serum conditions with similar results shown is a representative data. (D) IL-6 siRNA reduced cell cycle distribution of MIA-MSLN cells. MIA-MSLN cells treated with IL-6-specific siRNA as previously were allowed to grow in serum-free media for 24 h after initial growth media replenishing for 12 h posttransfection and collected for Propidium Iodide (PI) staining. The numbers of cells in each phase are plotted along the Y-axis. (E) IL-6 siRNA transfected and control MIA-MSLN cells were continued in culture for 96 h and subjected to Caspase3 activation detection by western blot. (F) In order to see which IL-6/stat3 regulated genes were affected by IL-6 siRNA treatment, control and siIL-6 treated MIA-MSLN cells were subject to western blot detection of various IL-6/stat3 regulated genes.
Fig. 5.
Fig. 5.
Auto/paracrine IL-6 trans-signaling is enhanced in MIA-MSLN cells through upregulated soluble IL-6 receptors. (A) Exogenous rIL-6 induces proliferation in MIA-MSLN cells. MIA-MSLN and control MIA-V cells were seeded in 96-well plates (2 × 10³ cells per well), serum starved (0% FBS) for 24 h and treated with indicated concentrations of IL-6 in 0.2% FBS containing medium for 3 days. Viability was measured with MTT. Relative increase in viability was measured by dividing viability at a time point by viability of same cells at day 0 (day after plating) and is plotted along Y-axis. Data plotted show mean of triplicate wells and is representative of at least two similar experiments. (B) IL-6 receptor gp80 and gp130 expression patterns in MIA-V and MIA-MSLN cells. IL-6 receptor gp80 and gp130 mRNA expression levels were determined by using real-time polymerase chain reaction in both MIA-V and MIA-MSLN cells. Y-axis shows GAPDH-normalized mRNA levels for gp80 and gp130 in MIA-V and MIA-MSLN cells. Relative mRNA level is presented as 2 [Ct(GAPDH)−Ct(IL-6)]. The bars denote SD of duplicate data. (C) Cell surface IL-6R (gp80) and soluble IL-6 receptor (sIL-6R) expression patterns in MIA-V and MIA-MSLN cells. (a) Cell surface gp80 expression was analyzed by FACS using anti-gp80 antibody. The results are depicted as histograms, the percentage denotes the positive cell population. sIL-6R expression in MIA-V and MIA-MSLN supernatants (b) was analyzed by western blot with anti-IL-6R antibody. *, # denote P < 0.05, and **, ## denote P < 0.01, compared with controls, t-test. (D) Effect of ADAM inhibitor TAPI-1 on the generation of sIL-6R in MIA-MSLN cells. Supernatant collected after 48 h treatment with the indicated concentrations of TAPI-1 or dimethyl sulfoxide were concentrated and used to detect the 50 kD sIL-6R band by western. (E) Treatment with TAPI-1 concurrently decreased the cell proliferation of MIA-MSLN cells as indicated. Relative increase in viability was measured by dividing viability at a time point by viability of same cells at day 0 (day after plating) and is plotted along Y-axis. Data plotted show mean of triplicate wells. *, # denote P < 0.05, and **, ## denote P < 0.01, compared with controls, t-test.
Fig. 6.
Fig. 6.
Blocking the IL-6/sIL-6R trans-signaling axis affects the growth/survival of MSLN expressing PC cell proliferation. (A) sIL-6R antibody blocking can reduce the endogenous IL-6-induced proliferation of MIA-MSLN cells. MIA-MSLN cells were seeded in 96-well plates (2 × 10³ cells per well), serum starved (0% FBS) for 24 h with or without anti-sIL-6R or isotype control antibody. The cells were then treated with 0.2% FBS containing medium for 3 days. Viability was measured with MTT. Relative viability was measured by dividing viability after a treatment by viability of same cells without treatment (or dimethyl sulfoxide treated) and is plotted along Y-axis. Data plotted show mean of triplicate wells and is representative of at least two similar experiments. (B). Soluble IL-6R antibody blocking can reduce the exogenous IL-6-induced proliferation of MIA-MSLN cells. MIA-MSLN cells were serum-starved (0% FBS) for 24 h with or without anti-sIL-6R or isotype control antibody and then treated with a cocktail of rIL-6/rsIL-6R in 0.2% FBS containing medium for 3 days. Viability was measured with MTT. Relative viability was measured by dividing viability of treated cells (treated with rIL-6/rsIL-6R cocktail with or without anti-sIL-6R antibody blocking) by that of untreated cells and is plotted along Y-axis. Data plotted show mean of triplicate wells. (C) IL6/sIL-6R trans-signaling axis is operative in MIA cell proliferation. Both MIA-V and MIA-MSLN cells were serum starved (0% FBS) for 24 h with or without anti-sIL-6R or isotype control antibody and then treated with a cocktail of rIL-6/rsIL-6R in 0.2% FBS containing media for 3 days. Viability was measured with MTT. Relative increase in viability was measured by dividing viability of treated cells (treated with rIL-6/rsIL-6R cocktail with or without anti-sIL-6R antibody blocking) by that of untreated cells and is plotted along Y-axis. Data plotted show mean of triplicate wells. *, # denote P < 0.05, and **, ## denote P < 0.01, compared with controls, t-test.
Fig. 7.
Fig. 7.
MSLN/IL-6 axis provides a major survival signal in PC cells affecting growth under both anchorage-dependent and independent conditions. (A) Relative MSLN and IL-6 mRNA expression in selected PC cells. Total mRNA from the cell lines were reverse transcribed and tested for MSLN/IL-6 expression. The left hand side Y-axis denotes MSLN mRNA levels in each cell line normalized to the GAPDH mRNA level. Relative mRNA level is presented as 2 [Ct(GAPDH)−Ct(MSLN)]. The bars denote SD of duplicate data. Line graph represents the IL-6 mRNA in the same cell lines and the right hand side Y-axis indicates normalized IL-6 levels. (B) Effect of blocking MSLN on cell growth of multiple PC cells. Hs766T, BxPC3, both expressing MSLN/IL-6 and AsPC-1 with high MSLN and low IL-6 were treated with pools of MSLN-specific siRNA or non-targeting scrambled siRNA and plated as per reverse transcription protocol in 96-well plates in triplicates. After 36 h, complete media was replaced by serum-free media and then after another 24 h by 0.2% serum containing media and cultured for 5 days. Relative viability was measured by dividing viability of treated cells (treated with MSLN/scrambled siRNA) by that of mock-treated cells using MTT and is plotted along Y-axis. Data plotted show mean of triplicate wells. *, denote P < 0.05, and **, denote P < 0.01, compared with controls, t-test. (C) Stable MSLN-silenced AsPC-shMSLN cells and proliferation. Cells were seeded in 96-well plates (2 × 10³ cells per well), serum starved (0% FBS) for 24 h before changing to fresh 0.2% FBS medium and cultured for 6 days. Viability was measured with MTT. Relative increase in viability was measured by dividing viability at a time point by viability of same cells at day 0 (day after plating) and is plotted along Y-axis. Data plotted show mean of triplicate wells. (D) Ability of MSLN-expressing cells to grow under anchorage-independent conditions. Cells were plated in ultra-low attachment plates and allowed to grow spheroid cultures for 8 days and then photographed. Shown are representative wells for each cell. (E) At 36 h posttransfection, BxPC3 cells treated with pools of MSLN/IL-6-specific siRNA or non-targeting scrambled siRNA in six-well plates were trypsinized and plated at 6000 cells per well of ultra-low attachment 96-well plates and cultured for 5 days before being photographed. (i) Spheroid colonies formed by BxPC3 ± IL-6/MSLN/scrambled siRNAs. (ii) Viability was measured by MTT. Relative viability was measured by dividing viability of treated cells (treated with MSLN/IL-6/scrambled siRNA) by that of mock-treated cells and is plotted along Y-axis. Data plotted show mean of triplicate wells. *, # denote P < 0.05, and **, ## denote P < 0.01, compared with controls, t-test. (F) Exogenous rIL-6 induces proliferation in MSLN-expressing PC cells. Cells were seeded in 96-well plates (3 × 10³ cells per well), serum starved (0% FBS) for 24 h and treated with IL-6 (100 ng/ml) ± sIL-6R (50 μg/ml) in serum-free medium for 5 days. Relative viability was measured by dividing viability after any treatment by viability of untreated cells by MTT and is plotted along Y-axis. Data plotted show mean of triplicate wells. Effect of blocking IL-6 and MSLN on growth of MSLN/IL-6-expressing cells under anchorage-dependent (G) conditions. Cell lines were treated with pools of IL-6-specific siRNA or non-targeting scrambled siRNA and plated as per reverse transcription protocol in 96-well plates in triplicates. After 36 h, serum-free media were added and then after another 24 h using 0.2% serum-containing media and cultured for 5 days. Relative viability was measured by dividing viability of treated cells (treated with IL-6/scrambled siRNA) by that of mock-treated cells using MTT and is plotted along Y-axis. Data plotted show mean of triplicate wells. *, # denote P < 0.05, and **, ## denote P < 0.01, compared with controls, t-test.

Similar articles

Cited by

References

    1. Hassan R, et al. Mesothelin: a new target for immunotherapy. Clin. Cancer Res. 2004;10:3937–3942. - PubMed
    1. Li M, et al. Mesothelin is a malignant factor and therapeutic vaccine target for pancreatic cancer. Mol. Cancer Ther. 2008;7:286–296. - PMC - PubMed
    1. Bharadwaj U, et al. Mesothelin-induced pancreatic cancer cell proliferation involves alteration of cyclin E via activation of signal transducer and activator of transcription protein 3. Mol. Cancer Res. 2008;6:1755–1765. - PMC - PubMed
    1. Uehara N, et al. Mesothelin promotes anchorage-independent growth and prevents anoikis via extracellular signal-regulated kinase signaling pathway in human breast cancer cells. Mol. Cancer Res. 2008;6:186–193. - PubMed
    1. Adachi Y, et al. Interleukin-6 induces both cell growth and VEGF production in malignant mesotheliomas. Int. J. Cancer. 2006;119:1303–1311. - PubMed

Publication types