. 2011 Mar 8;7(3):625-632.
doi: 10.1021/ct100641a.

NCIPLOT: a program for plotting non-covalent interaction regions

Affiliations

NCIPLOT: a program for plotting non-covalent interaction regions

Julia Contreras-García et al. J Chem Theory Comput. .

Abstract

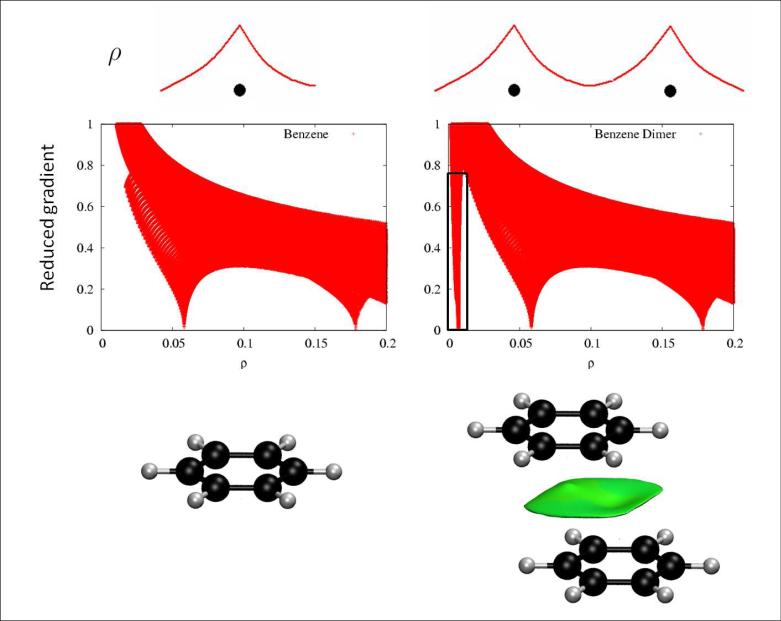
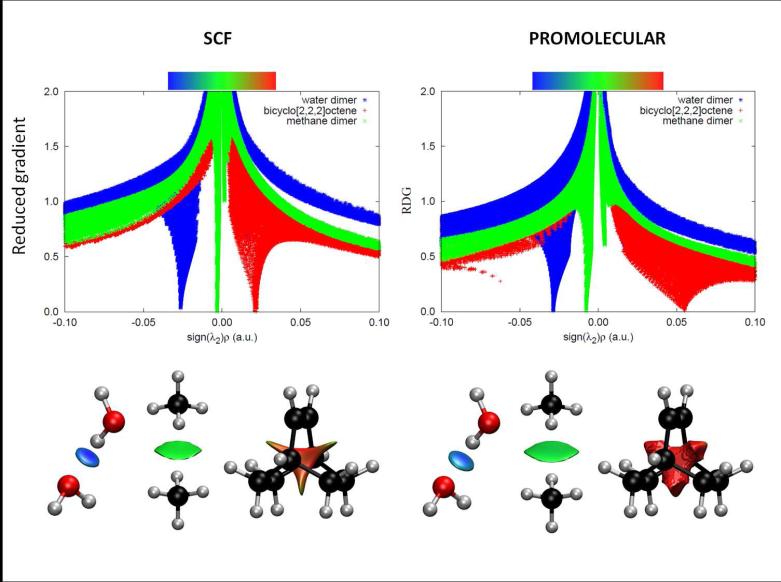
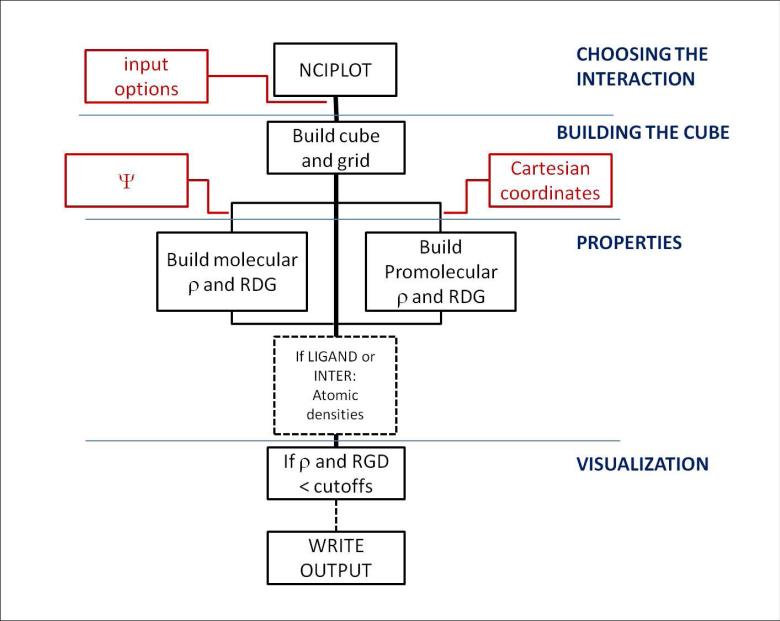
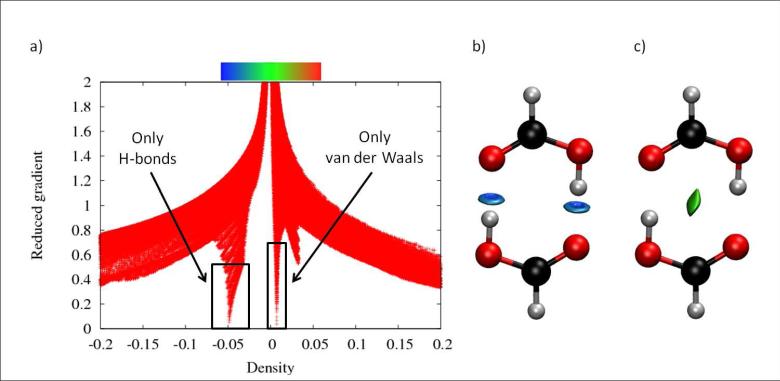
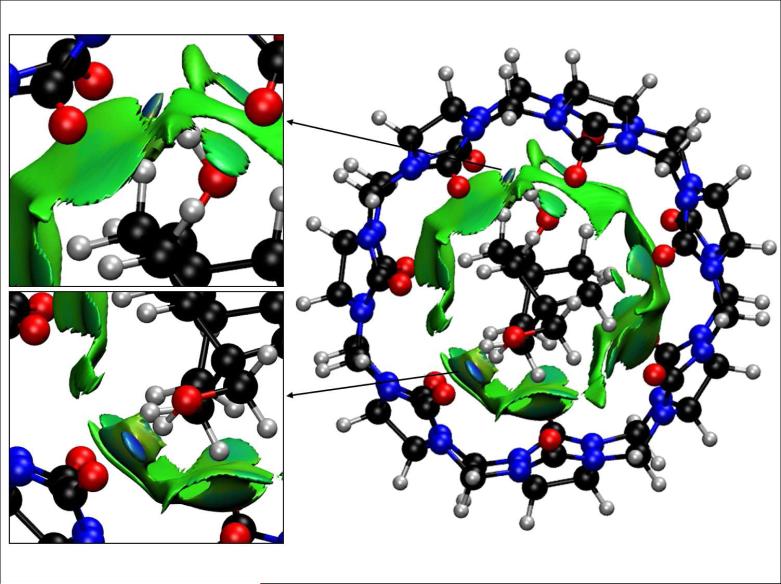
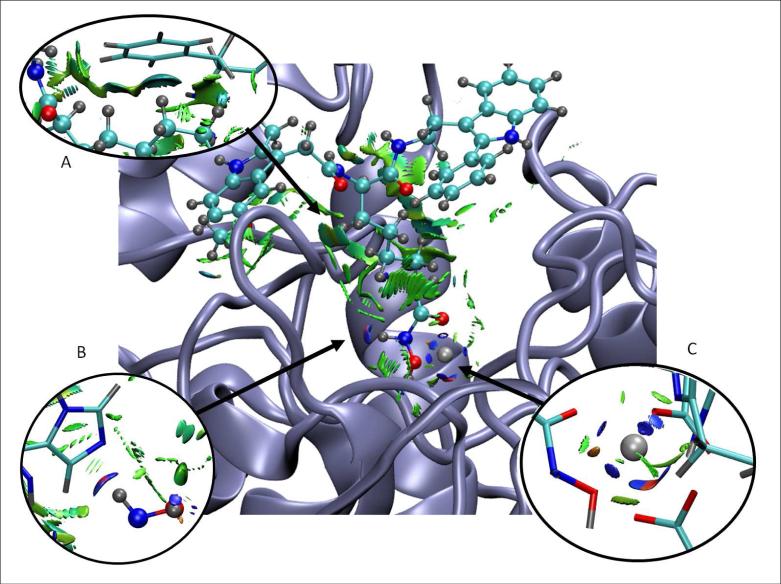
Non-covalent interactions hold the key to understanding many chemical, biological, and technological problems. Describing these non-covalent interactions accurately, including their positions in real space, constitutes a first step in the process of decoupling the complex balance of forces that define non-covalent interactions. Because of the size of macromolecules, the most common approach has been to assign van der Waals interactions (vdW), steric clashes (SC), and hydrogen bonds (HBs) based on pairwise distances between atoms according to their van der Waals radii. We recently developed an alternative perspective, derived from the electronic density: the Non-Covalent Interactions (NCI) index [J. Am. Chem. Soc. 2010, 132, 6498]. This index has the dual advantages of being generally transferable to diverse chemical applications and being very fast to compute, since it can be calculated from promolecular densities. Thus, NCI analysis is applicable to large systems, including proteins and DNA, where analysis of non-covalent interactions is of great potential value. Here, we describe the NCI computational algorithms and their implementation for the analysis and visualization of weak interactions, using both self-consistent fully quantum-mechanical, as well as promolecular, densities. A wide range of options for tuning the range of interactions to be plotted is also presented. To demonstrate the capabilities of our approach, several examples are given from organic, inorganic, solid state, and macromolecular chemistry, including cases where NCI analysis gives insight into unconventional chemical bonding. The NCI code and its manual are available for download at http://www.chem.duke.edu/~yang/software.htm.


Figures

FIG. 1
FIG. 1
a) Representative behavior of an atomic density. b) Appearance of a s(ρ(r)) singularity when two atomic densities approach each other. c-d) Comparison of the reduced density behavior for benzene monomer and dimer; a singularity in s appears at low density values in the dimer case. e) Benzene monomer. f) Appearance of an intermolecular interaction surface in benzene dimer, associated with the additional singularity in the s(ρ) plot. The isosurface was generated for s = 0.7 au and ρ < 0.01 au.
FIG. 2
FIG. 2
Top: Overlapping troughs in s(ρ) plots can be distinguished when sign(λ2)ρ is used as the ordinate. Favorable interactions appear on the left, unfavorable on the right, and van der Waals near zero. The same s(ρ) features are obtained using self-consistent (left) and promolecular (right) calculations, with a shift toward negative (stabilizing) regimes. Bottom: Taking the shift in troughs into account (i.e. changing the cutoff), the isosurface shapes remain qualitatively unaltered for selected small molecules. Figures are shown for both SCF (left) and promolecular densities (right). NCI surfaces correspond to s = 0.6 au and a colour scale of −0.03 < ρ < 0.03 au for SCF densities. For promolecular densities, s = 0.5 au (water and methane dimers) or s = 0.35 au (bicyclo[2,2,2]octene) and the colour scale is −0.04 < ρ < 0.04 au.
FIG. 3
FIG. 3
Flow chart for program routines for non-covalent interactions visualization in NCIPLOT. Red labels highlight the information that can be input by the user, whereas black labels show the internal flow of information. The flow is divided into four main algorithmic parts: input, cube construction, properties, and visualization.
FIG. 4
FIG. 4
NCI analysis of formic acid dimer. a) s(ρ) plot for the SCF density. Peaks appear at ρ ≃0.01 au for vdW and ρ ≃0.05 au for hydrogen bonds. b) If the cutoffs are set at s = 0.7 au and ρ < 0.02 au, the isosurface only recovers the van der Waals interactions in the system. c) If the cutoffs are set at s = 0.5 au and 0.02 < ρ < 0.06 au, only the hydrogen bonds are displayed. The NCI colour scale is −0.06 < ρ < 0.06 au.
FIG. 5
FIG. 5
Results of several input options for the selective representation of a given interaction based on a) its localization in 3D space, defined by the cube, b) its localization in 3D space, defined by a radial threshold around a point (in this case, the center of the top benzene was chosen) c) its inter/intramolecular nature, in this case only intermolecular interactions are shown. NCI surfaces correspond to s = 0.4 au and a colour scale of −0.04 < ρ < 0.04 au, using promolecular densities.
FIG. 6
FIG. 6
S4N4 main conformations a) Boat conformation b) Cage conformation. The boat conformation is more stable due to the bridging S-S bond. NCI surfaces correspond to s = 0.4 au and a colour scale of −0.05 < ρ < 0.05 au.
FIG. 7
FIG. 7
Complexes of Hg. a)[Hg(H2O)3]2+ b)[Hg(F)3] c)[Hg(Cl)3] d)[Hg(Br)3] . NCI surfaces correspond to s = 0.3 au and a colour scale of −0.1 < ρ < 0.1 au.
FIG. 8
FIG. 8
Dihydrogen interactions in a BH3NH3 tetramer in a) the fully-optimized gas-phase geometry and b) the solid-state geometry. NCI surfaces correspond to s = 0.4 au and a colour scale of −0.03 < ρ < 0.03 au.
FIG. 9
FIG. 9
Cucurbit[7]uril-bicyclo[2,2,2]octane derivative inclusion complex. Anchor posts are highlighted in the insets. NCI surfaces show only intermolecular interactions. The gradient cut-off is s = 0.5 au and the colour scale is −0.04 < ρ < 0.04 au.
FIG. 10
FIG. 10
NCI surface around a V5X ligand in the active site of HDAC8 protein. Specific interactions are enlarged in the insets. NCI surfaces show only intermolecular interactions. The gradient cut-off is s = 0.35 au and the colour scale is −0.04 < ρ < 0.02 au.

References

    1. Chandler D. Nature. 2005;437:640. - PubMed
    2. Panigrahi SK, Desiraju GR. Proteins: Struct., Funct., Bioinf. 2007;67:128. - PubMed
    1. Fenniri H, Packiarajan M, Vidale KL, Sherman DM, Hallenga K, Wood KV, Stowell JG. J. Am. Chem. Soc. 2001;123:3854. - PubMed
    2. Kruse P, Johnson ER, DiLabio GA, Wolkow RA. Nano Lett. 2002;2:807.
    1. Fiedler S, Broecker J, Keller S. Cell. Mol. Life Sci. 2010;67:1779. - PMC - PubMed
    2. Dill KA. Biochemistry. 1990;29:7133. - PubMed
    1. Silvi B. Phys. Rev. Lett. 1994;73:842. - PubMed
    1. Bickelhaupt FM, Baerends E. Angew. Chem. Int. Ed. 2003;42:4183. - PubMed

LinkOut - more resources