

A mechanistic modeling system for estimating large scale emissions and transport of pollen and co-allergens
- PMID: 21516207
- PMCID: PMC3079563
- DOI: 10.1016/j.atmosenv.2010.12.008
A mechanistic modeling system for estimating large scale emissions and transport of pollen and co-allergens
Abstract
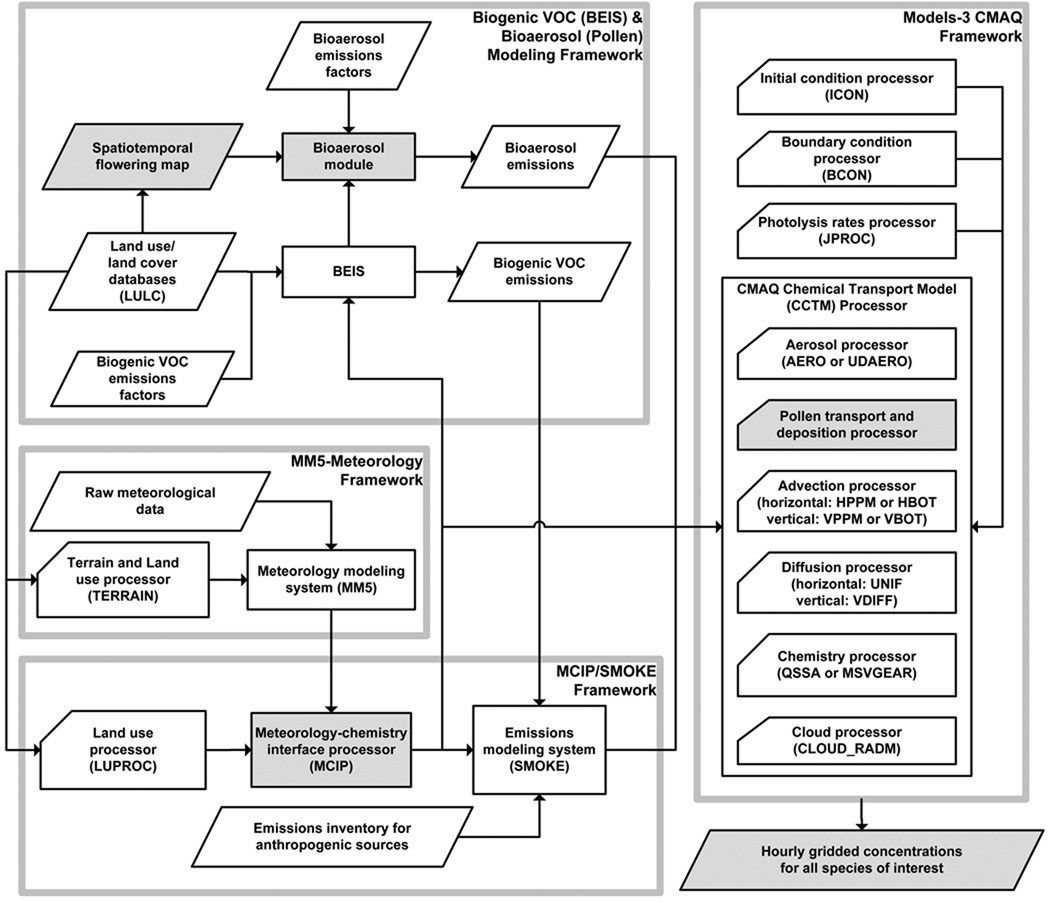
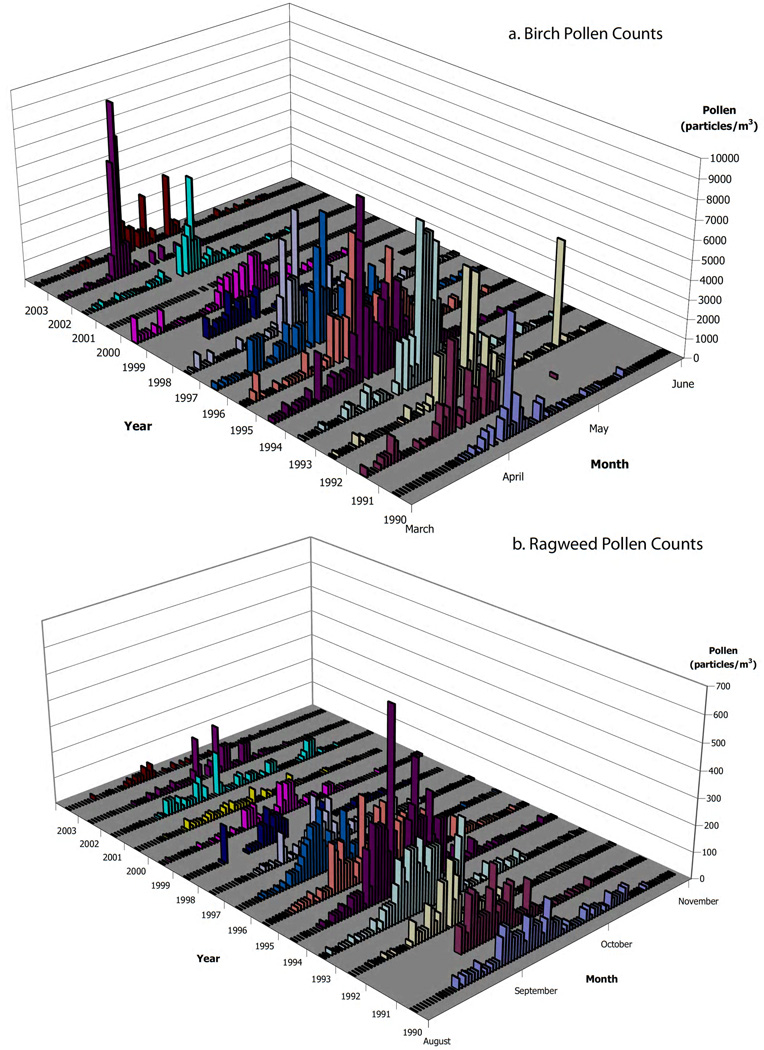
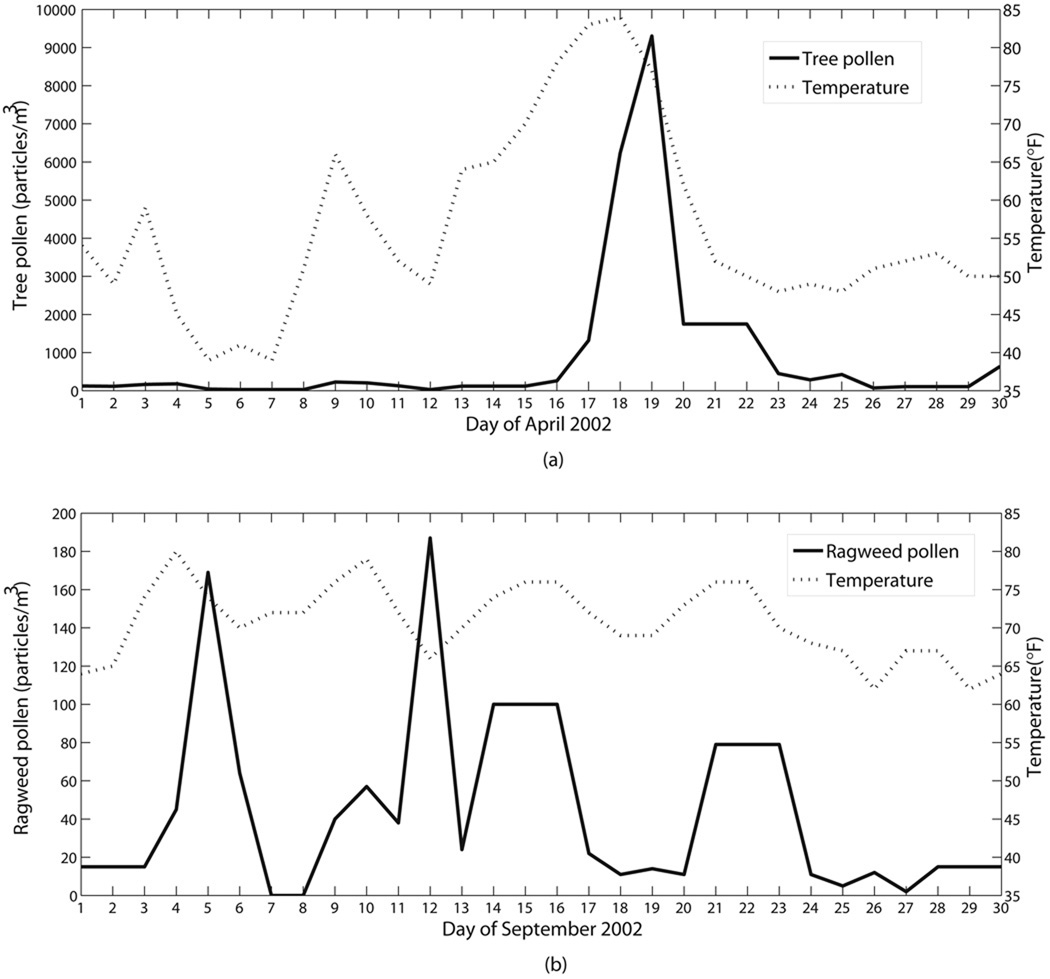
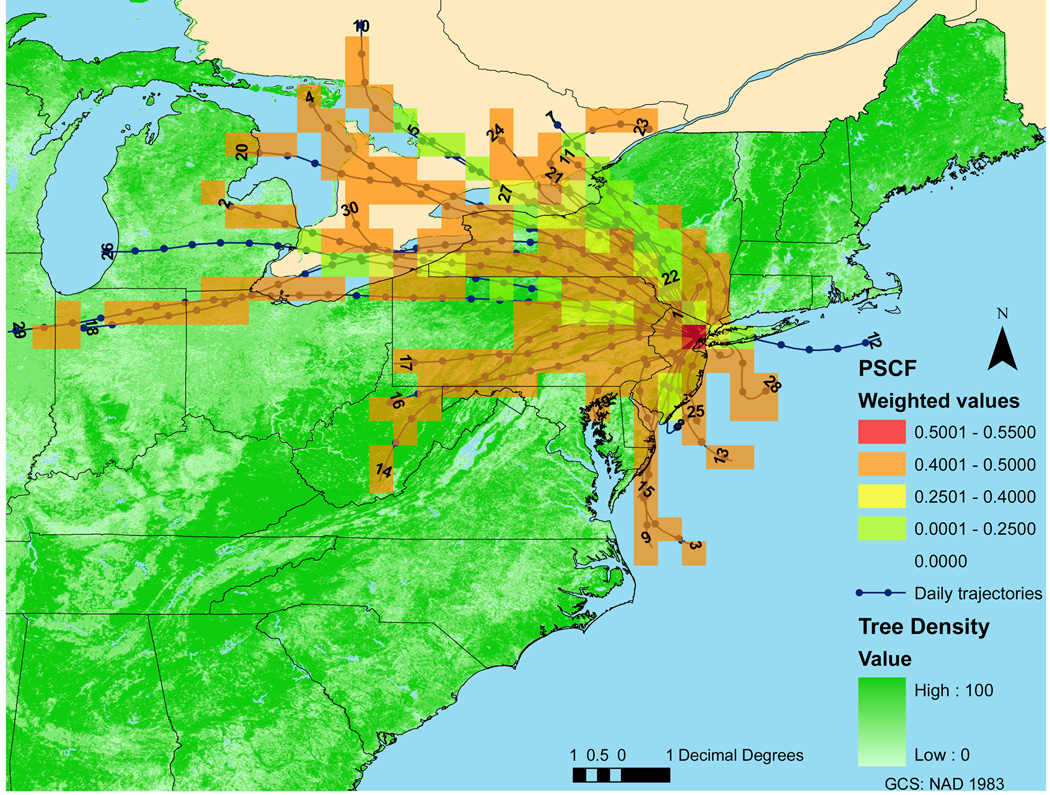
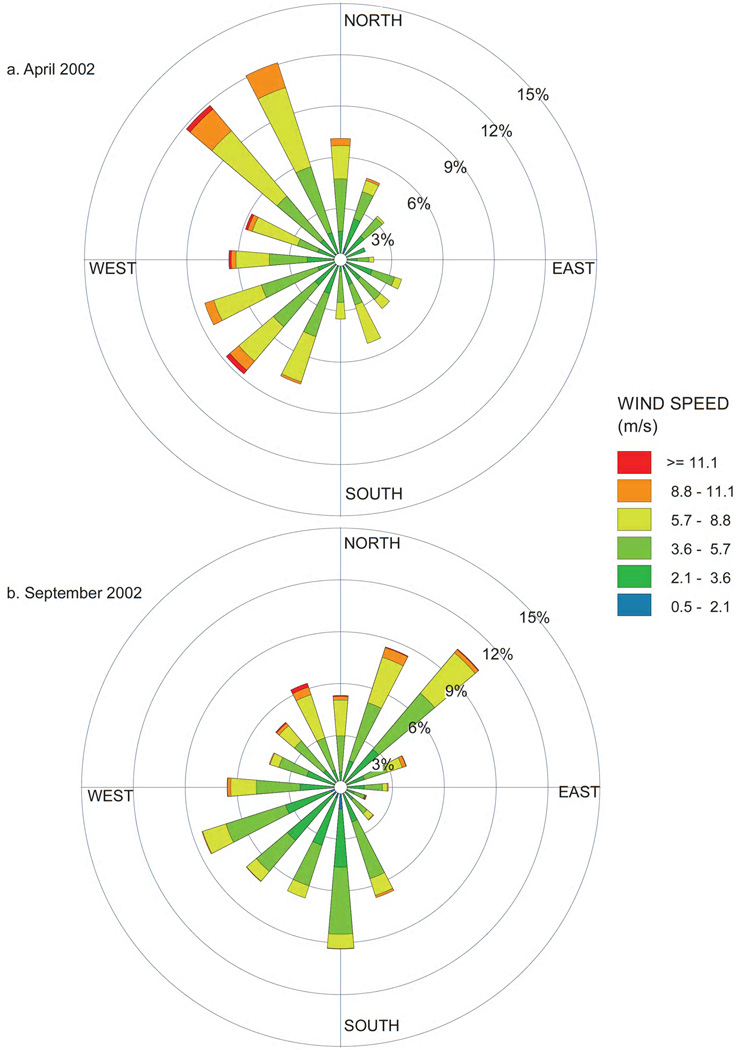
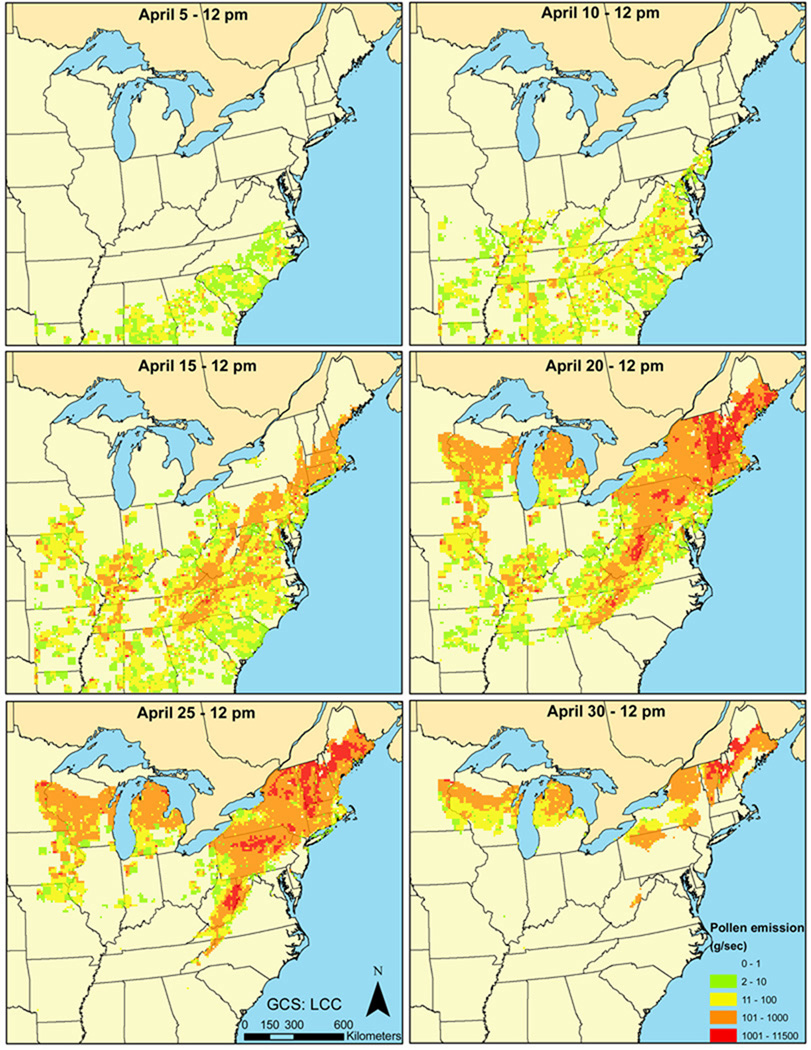
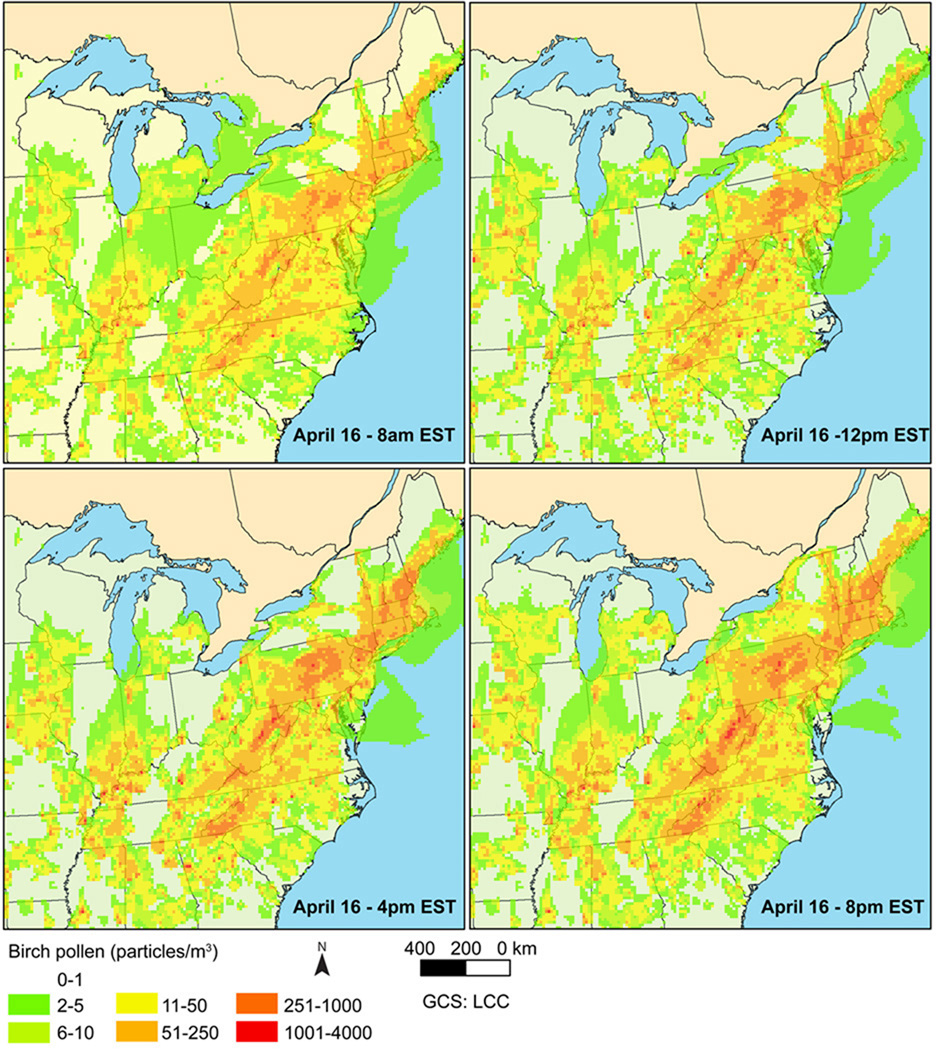
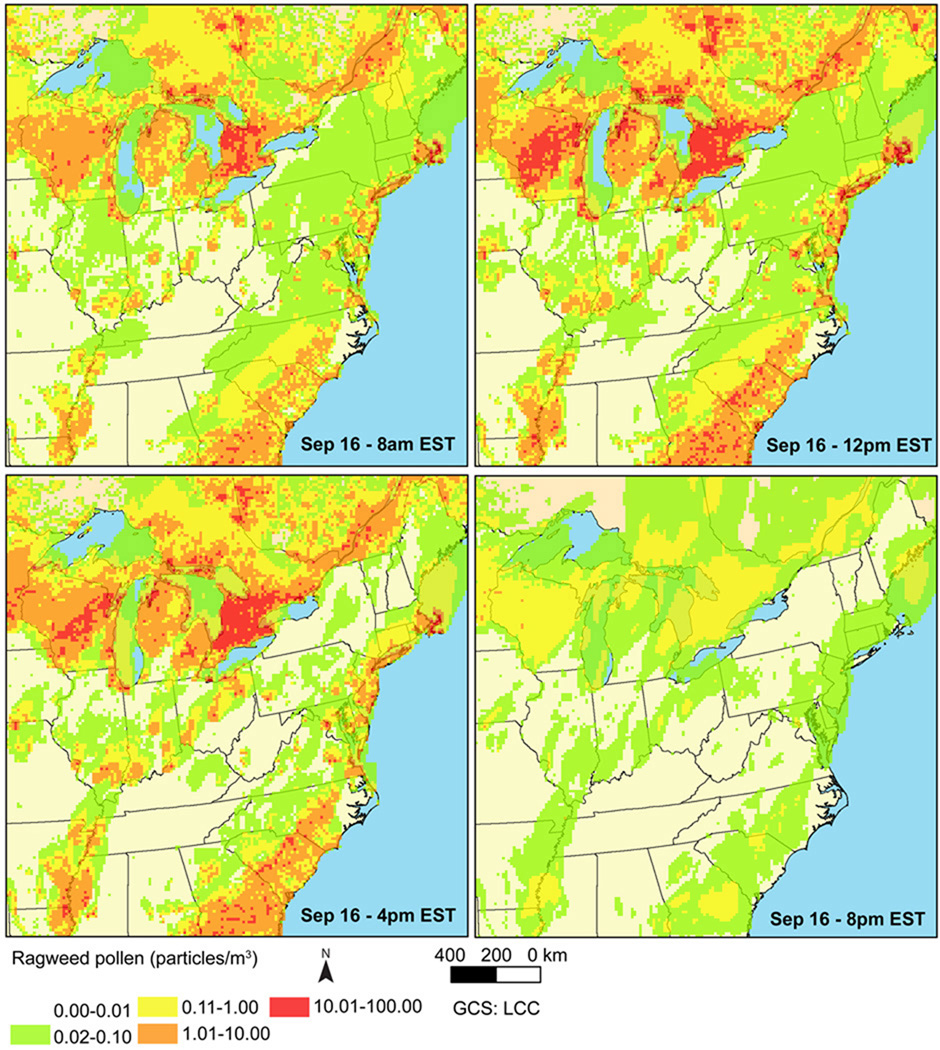
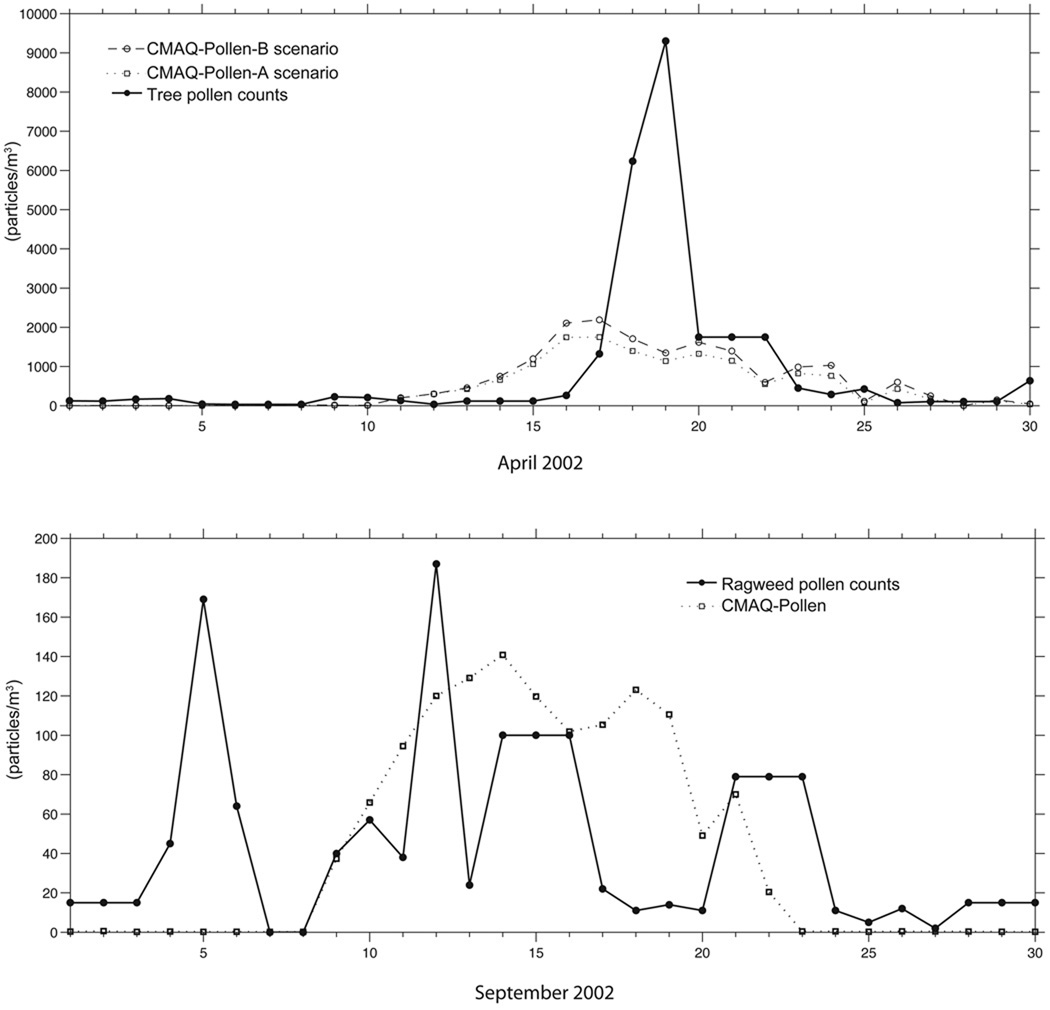
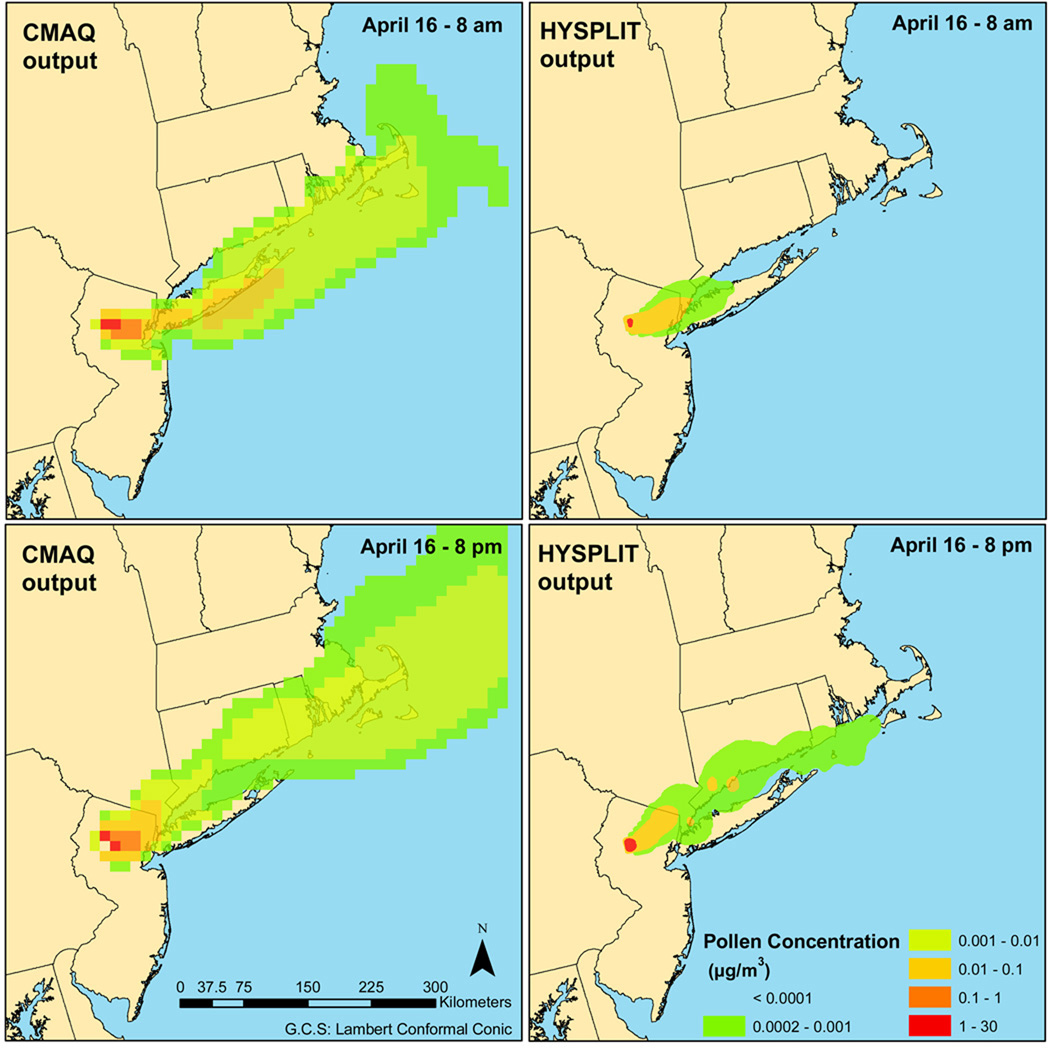
Allergic airway diseases represent a complex health problem which can be exacerbated by the synergistic action of pollen particles and air pollutants such as ozone. Understanding human exposures to aeroallergens requires accurate estimates of the spatial distribution of airborne pollen levels as well as of various air pollutants at different times. However, currently there are no established methods for estimating allergenic pollen emissions and concentrations over large geographic areas such as the United States. A mechanistic modeling system for describing pollen emissions and transport over extensive domains has been developed by adapting components of existing regional scale air quality models and vegetation databases. First, components of the Biogenic Emissions Inventory System (BEIS) were adapted to predict pollen emission patterns. Subsequently, the transport module of the Community Multiscale Air Quality (CMAQ) modeling system was modified to incorporate description of pollen transport. The combined model, CMAQ-pollen, allows for simultaneous prediction of multiple air pollutants and pollen levels in a single model simulation, and uses consistent assumptions related to the transport of multiple chemicals and pollen species. Application case studies for evaluating the combined modeling system included the simulation of birch and ragweed pollen levels for the year 2002, during their corresponding peak pollination periods (April for birch and September for ragweed). The model simulations were driven by previously evaluated meteorological model outputs and emissions inventories for the eastern United States for the simulation period. A semi-quantitative evaluation of CMAQ-pollen was performed using tree and ragweed pollen counts in Newark, NJ for the same time periods. The peak birch pollen concentrations were predicted to occur within two days of the peak measurements, while the temporal patterns closely followed the measured profiles of overall tree pollen. For the case of ragweed pollen, the model was able to capture the patterns observed during September 2002, but did not predict an early peak; this can be associated with a wider species pollination window and inadequate spatial information in current land cover databases. An additional sensitivity simulation was performed to comparatively evaluate the dispersion patterns predicted by CMAQ-pollen with those predicted by the Hybrid Single-Particle Lagrangian Integrated Trajectory (HYSPLIT) model, which is used extensively in aerobiological studies. The CMAQ estimated concentration plumes matched the equivalent pollen scenario modeled with HYSPLIT. The novel pollen modeling approach presented here allows simultaneous estimation of multiple airborne allergens and other air pollutants, and is being developed as a central component of an integrated population exposure modeling system, the Modeling Environment for Total Risk studies (MENTOR) for multiple, co-occurring contaminants that include aeroallergens and irritants.
Figures
References
-
- Aas K, Aberg N, Bachert C, Bergmann K, Bergmann R, Bonini S, Bousquet J, de Weck A, Farkas I, Hejdenberg K. Technical Report. Brussels: The UCB Institute of Allergy; 1997. European allergy white paper: Allergic diseases as a public health problem.
-
- Adhikari A, Reponen T, Grinshpun S, Martuzevicius D, LeMasters G. Correlation of ambient inhalable bioaerosols with particulate matter and ozone: a two-year study. Environmental Pollution. 2006;140:16–28. - PubMed
-
- Aylor D. Settling speed of corn (zea mays) pollen. Journal of Aerosol Science. 2002;33:1601–1607.
-
- Behrendt H, Becker W. Localization, release and bioavailability of pollen allergens: the influence of environmental factors. Current Opinion in Immunology. 2001;13:709–715. - PubMed
-
- Black T. The new nmc mesoscale eta model: Description and forecast examples. Weather and Forecasting. 1994;9:265–278.
Grants and funding
LinkOut - more resources
Full Text Sources
Other Literature Sources
Miscellaneous