. 2011 Jul;118(1):79-92.
doi: 10.1111/j.1471-4159.2011.07290.x. Epub 2011 May 19.

Mitochondrial aconitase knockdown attenuates paraquat-induced dopaminergic cell death via decreased cellular metabolism and release of iron and H₂O₂

Affiliations

Mitochondrial aconitase knockdown attenuates paraquat-induced dopaminergic cell death via decreased cellular metabolism and release of iron and H₂O₂

David Cantu et al. J Neurochem. 2011 Jul.

Abstract

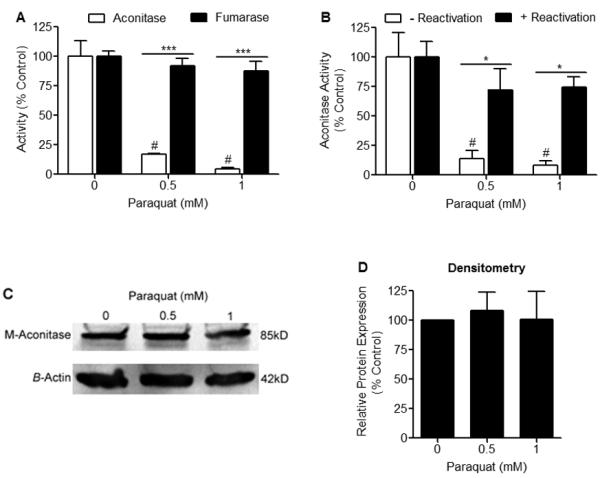
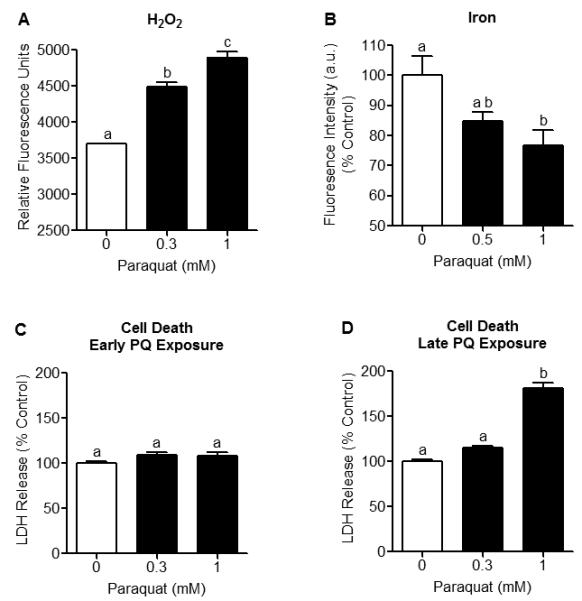
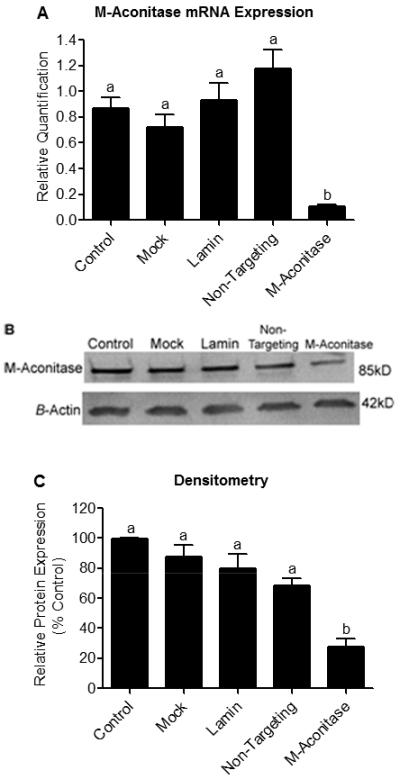
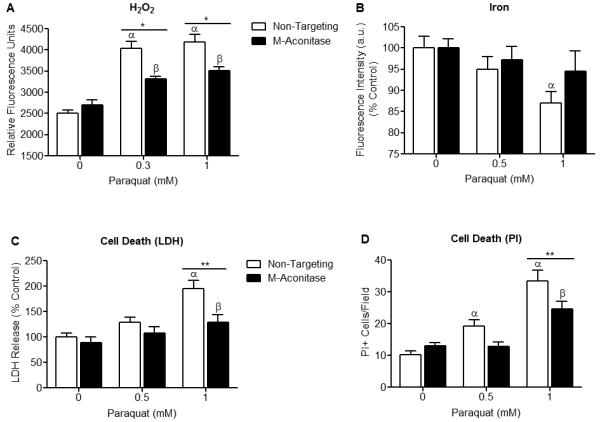
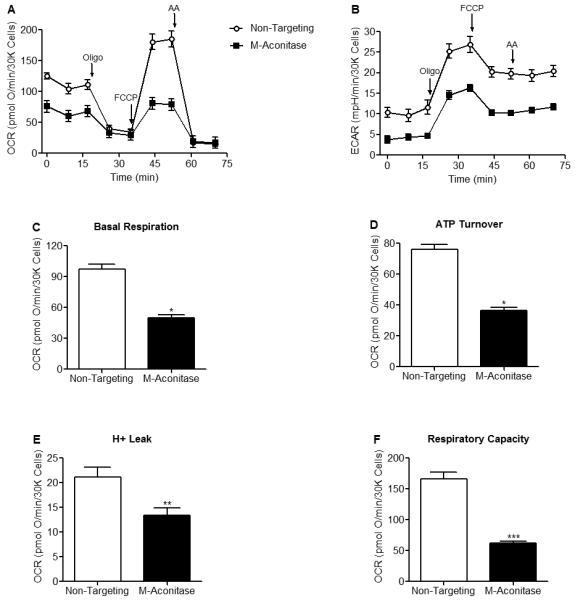
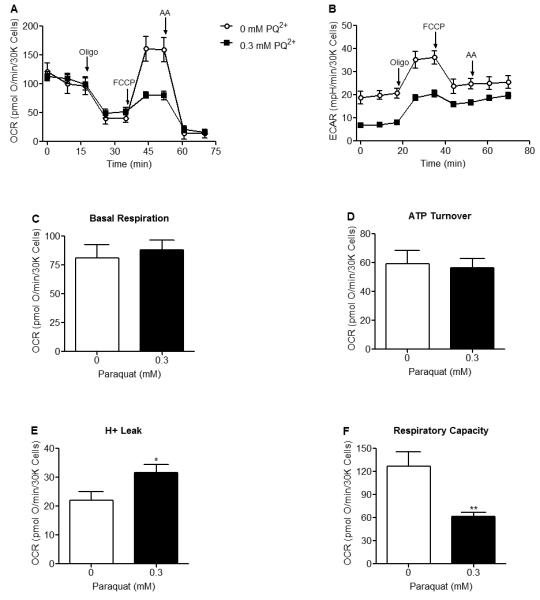
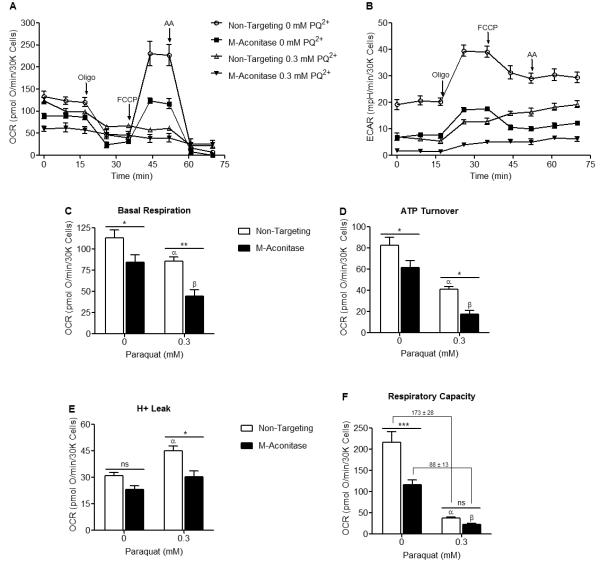
Mitochondrial oxidative stress is a contributing factor in the etiology of numerous neuronal disorders. However, the precise mechanism(s) by which mitochondrial reactive oxygen species modify cellular targets to induce neurotoxicity remains unknown. In this study, we determined the role of mitochondrial aconitase (m-aconitase) in neurotoxicity by decreasing its expression. Incubation of the rat dopaminergic cell line, N27, with paraquat (PQ(2+) ) resulted in aconitase inactivation, increased hydrogen peroxide (H(2) O(2) ) and increased ferrous iron (Fe(2+) ) at times preceding cell death. To confirm the role of m-aconitase in dopaminergic cell death, we knocked down m-aconitase expression via RNA interference. Incubation of m-aconitase knockdown N27 cells with PQ(2+) resulted in decreased H(2) O(2) production, Fe(2+) accumulation, and cell death compared with cells expressing basal levels of m-aconitase. To determine the metabolic role of m-aconitase in mediating neuroprotection, we conducted a complete bioenergetic profile. m-Aconitase knockdown N27 cells showed a global decrease in metabolism (glycolysis and oxygen consumption rates) which blocked PQ(2+) -induced H(+) leak and respiratory capacity deficiency. These findings suggest that dopaminergic cells are protected from death by decreasing release of H(2) O(2) and Fe(2+) in addition to decreased cellular metabolism.


Figures

Figure 1
Figure 1. Selective decrease in aconitase activity in N27 cells following PQ2+ treatment
(A) N27 cells were treated with 0, 0.5, and 1 mM PQ2+ for 4 hrs and activities of aconitase and fumarase were measured spectrophotometrically. Aconitase activity was significantly decreased in the presence of PQ2+, while fumarase activity remained unchanged, # indicates statistical significance compared to aconitase activity from cells treated with 0 mM PQ2+, * indicates statistical difference between aconitase and fumarase activities, (n = 3-4). Bars represent mean ± SEM, (p < 0.05, two-way ANOVA). (B) N27 cells were treated with 0, 0.5, and 1 mM PQ2+ for 4 hrs. Cell lysates were collected and incubated with (+) or without (−) reactivation buffer (FAS, Na2S, DTT) for 30 min at 37°C. N27 cell lysates treated without reactivation buffer showed a significant decrease in aconitase activity in the presence of PQ2+, while lysates treated with reactivation buffer showed no difference in activity, # indicates statistical difference compared to 0 mM PQ2+ (−) reactivation, * indicates statistical difference between (−) reactivation and (+) reactivation, (n = 3). Bars represent mean ± SEM, (p < 0.05, two-way ANOVA). (C) Representative Western blot of 3 independent experiments showing m-aconitase apoprotein levels remain unchanged after 4 hrs of 0, 0.5, and 1 mM PQ2+. (D) Densitometry analysis of m-aconitase apoprotein levels shown in (C) showing no difference in relative protein expression. Bars represent mean ± SEM, (n = 3).
Figure 2
Figure 2. H2O2 production and mitochondrial Fe2+ levels increase prior to the onset of cell death in N27 cells treated with PQ2+
N27 cells were incubated with PQ2+ at early (4-6 hrs) and late (18 hrs) time-points. (A) H2O2 production was measured in N27 cells using Amplex Red. A concentration-dependent increase in H2O2 production was observed after early PQ2+ exposure. Data are expressed as relative fluorescent units of Amplex Red, (n = 6). (B) Mitochondrial Fe2+ was measured using RPA fluorescence. Fluorescence intensity of RPA was significantly quenched after early exposure to 1 mM PQ2+, indicating increased mitochondrial Fe2+. Treatment of N27 cells with 0.5 mM PQ2+ was not statistically different from 0 mM or 1 mM PQ2+. Mean pixel intensity of 5 random fields/well was quantified using Image J (NIH) and expressed as % control, (n = 5-6). (C) Cell death was assessed by measuring LDH release and showed no difference after early PQ2+ exposure, (n = 5-6). (D) LDH release significantly increased after late exposure to 1 mM PQ2+. Bars represent mean ± SEM, bars with different letters were statistically different from one another (p < 0.05, one-way ANOVA).
Figure 3
Figure 3. m-Aconitase mRNA and protein expression are decreased with m-aconitase siRNA transfection
N27 cells were transfected with m-aconitase siRNA and compared to non-transfected cells (control), mock transfected cells (mock), lamin siRNA transfected cells (lamin), and non-targeting siRNA transfected cells (non-targeting) for 72 hrs. (A) m-aconitase mRNA expression was measured by real-time PCR. Cells transfected with m-aconitase siRNA demonstrated ~87% decrease in m-aconitase mRNA expression compared to control and ~91% decrease compared to non-targeting siRNA. m-Aconitase mRNA values were normalized to expression of 18S ribosomal RNA (used as an endogenous control) and expressed as relative quantification, (n = 2-4). (B) m-Aconitase protein expression was assessed via Western blot analysis. m-Aconitase siRNA transfection decreased m-aconitase protein expression compared to control and non-targeting siRNA transfection. Protein levels were normalized to β-actin expression, representative blot of 3 independent experiments. (C) Densitometry analysis of m-aconitase protein levels shown in (B). N27 cells transfected with m-aconitase siRNA showed ~73% decrease in m-aconitase protein levels compared to control and ~60% compared to non-targeting siRNA, (n = 3). Bars represent mean ± SEM, bars with different letters were statistically different from one another (p < 0.05, one-way ANOVA).
Figure 4
Figure 4. m-Aconitase knockdown N27 cells produce less H2O2, mitochondrial Fe2+, and cell death following PQ2+ treatment
(A) N27 cells were transfected with non-targeting or m-aconitase siRNA for 72 hrs, treated with PQ2+, and H2O2 was measured using Amplex Red. H2O2 production was significantly attenuated in m-aconitase knockdown cells (m-aconitase) compared to cells expressing basal m-aconitase (non-targeting) after early exposure to 0.3 and 1 mM PQ2+. Data are expressed as relative fluorescent units, (n = 5). (B) N27 cells were transfected with non-targeting siRNA or m-aconitase siRNA for 72 hrs, treated with PQ2+, and mitochondrial iron was measured by the quenching of RPA from 5 random fields/well. After early exposure with 1 mM PQ2+, cells expressing basal levels of m-aconitase (non-targeting) showed a significant decrease in RPA quenching (indicating an increase in iron). This effect was attenuated in m-aconitase knockdown cells (m-aconitase), (n = 5). (C) Cells were transfected with non-targeting or m-aconitase siRNA for 72 hrs and treated with PQ2+. Cell death was evaluated after late exposure to PQ2+ via release of extracellular LDH. PQ2+-induced cell death was attenuated in m-aconitase knockdown cells compared to cells expressing basal levels of m-aconitase, (n = 6-8). (D) Cell death was verified by counting PI+ stained cells after late exposure to PQ2+. Quantification of m-aconitase knockdown cells showed decreased PI+ cells compared to cells expressing basal m-aconitase. PI+ cells were counted from 5 randomly selected fields/well, (n = 5-6). Bars represent mean ± SEM, α indicates statistical difference compared to non-targeting, 0 mM PQ2+; β indicates statistical difference compared to m-aconitase, 0 mM PQ2+; * indicates statistical difference between non-targeting and m-aconitase, (p < 0.05, two-way ANOVA).
Figure 5
Figure 5. Oxygen consumption rates, glycolytic rates and respiration parameters are decreased in m-aconitase knockdown N27 cells
Cells were transfected with non-targeting or m-aconitase siRNA for 72 hrs and oxygen consumption rates and glycolytic rates were measured using a Seahorse XF24 Analyzer. (A) Basal and FCCP-stimulated oxygen consumption rates were decreased in m-aconitase knockdown cells (m-aconitase, closed squares) compared to cells expressing basal levels of m-aconitase (non-targeting, open circles). (B) Rates of glycolysis were decreased in m-aconitase knockdown cells compared to cells expressing basal m-aconitase. (C) Basal respiration, (D) ATP turnover, (E) H+ leak and (F) Respiratory capacity were all significantly decreased in m-aconitase knockdown cells compared to cells expressing basal levels of m-aconitase, (n = 10). Arrows indicate where oligomycin (oligo), FCCP and antimycin A (AA) were added. Data points and bars represent mean ± SEM, * indicates significant difference compared to non-targeting siRNA transfected cells (p < 0.05, student’s t-test).
Figure 6
Figure 6. FCCP-stimulated oxygen consumption rates, glycolytic rates and respiratory capacity are decreased in PQ2+ treated N27 cells
Oxygen consumption rates and glycolytic rates were measured using a Seahorse XF24 Analyzer after early exposure to 0 or 0.3 mM PQ2+. (A) FCCP-stimulated oxygen consumption rates were decreased in 0.3 mM PQ2+ incubated cells (closed squares) compared to control (0 mM PQ2+, open circles). (B) Rates of glycolysis were decreased in 0.3 mM PQ2+ incubated cells compared to control (0 mM PQ2+). (C,D) No change in basal respiration or ATP turnover was observed after early PQ2+ exposure. (E) H+ leak was significantly increased in 0.3 mM PQ2+ treated N27 cells compared to control (0 mM PQ2+). (F) Respiratory capacity was significantly decreased in 0.3 mM PQ2+ treated N27 cells compared to control (0 mM PQ2+). Similar results were seen with 1mM PQ2+ (data not shown). Arrows indicate where oligomycin (oligo), FCCP and antimycin A (AA) were added, * indicates significant difference compared to 0 mM PQ2+, (n = 5). Data points and bars represent mean ± SEM, (p < 0.05, student’s t-test).
Figure 7
Figure 7. PQ2+ exacerbates basal and stimulated OCR and glycolysis but attenuates H+ leak and respiratory capacity in m-aconitase knockdown N27 cells
Cells were transfected with non-targeting and m-aconitase siRNA for 72 hrs and oxygen consumption and glycolytic rates were measured after early exposure to 0 or 0.3 mM PQ2+. (A and B) Oxygen consumption and glycolytic rates were exacerbated in PQ2+-treated, m-aconitase transfected N27 cells; non-targeting, 0 mM PQ2+ (open circles); m-aconitase, 0 mM PQ2+ (closed squares), non-targeting, 0.3 mM PQ2+ (open triangle); and m-aconitase, 0.3 mM PQ2+ (closed triangle). (C-D) Basal respiration and ATP turnover were exacerbated in PQ2+-treated, m-aconitase transfected cells. (E) PQ2+-dependent increase in H+ leak was significantly reversed in m-aconitase knockdown cells. (F) PQ2+-dependent decrease in respiratory capacity was not significantly different between m-aconitase knockdown cells (m-aconitase) and cells expressing basal levels of m-aconitase (non-targeting). Values shown are in pmolO2/min/30Kcells. Arrows indicate where oligomycin (oligo), FCCP and antimycin A (AA) were added, (n = 5). Data points and bars represent mean ± SEM, α indicates statistical difference compared to non-targeting, 0 mM PQ2+; β indicates statistical difference compared to m-aconitase, 0 mM PQ2+; * indicates statistical difference between non-targeting and m-aconitase, (p < 0.05, two-way ANOVA).

References

    1. Andres-Mateos E, Perier C, Zhang L, Blanchard-Fillion B, Greco TM, Thomas B, Ko HS, Sasaki M, Ischiropoulos H, Przedborski S, Dawson TM, Dawson VL. DJ-1 gene deletion reveals that DJ-1 is an atypical peroxiredoxin-like peroxidase. Proc Natl Acad Sci U S A. 2007;104:14807–14812. - PMC - PubMed
    1. Arthur CR, Morton SL, Dunham LD, Keeney PM, Bennett JP., Jr. Parkinson’s disease brain mitochondria have impaired respirasome assembly, age-related increases in distribution of oxidative damage to mtDNA and no differences in heteroplasmic mtDNA mutation abundance. Mol Neurodegener. 2009;4:37. - PMC - PubMed
    1. Baron M, Kudin AP, Kunz WS. Mitochondrial dysfunction in neurodegenerative disorders. Biochem Soc Trans. 2007;35:1228–1231. - PubMed
    1. Beal MF. Mitochondrial dysfunction in neurodegenerative diseases. Biochim Biophys Acta. 1998;1366:211–223. - PubMed
    1. Berg D, Youdim MB. Role of iron in neurodegenerative disorders. Top Magn Reson Imaging. 2006;17:5–17. - PubMed

Publication types

MeSH terms