Review
. 2011 Apr 25:10:47.
doi: 10.1186/1476-4598-10-47.

RNA polymerase III transcription in cancer: the BRF2 connection

Affiliations
Review

RNA polymerase III transcription in cancer: the BRF2 connection

Stephanie Cabarcas et al. Mol Cancer. .

Abstract

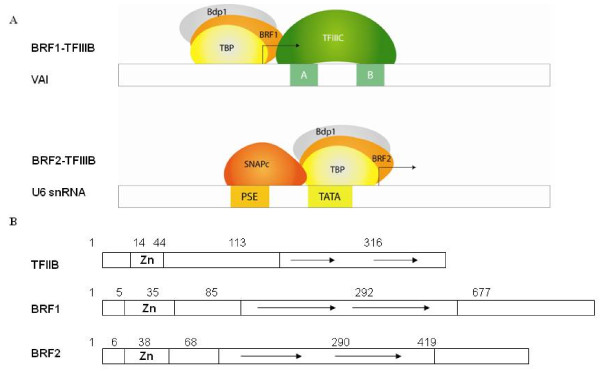
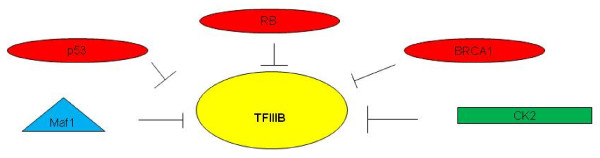
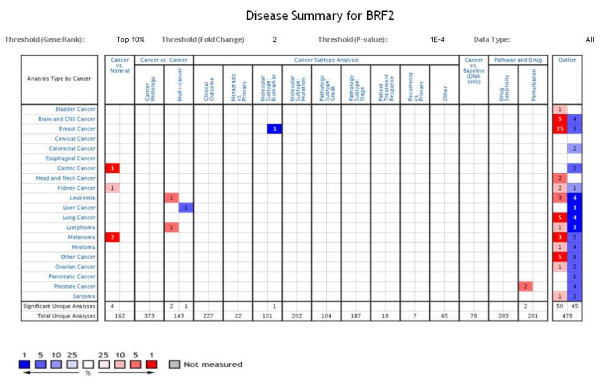
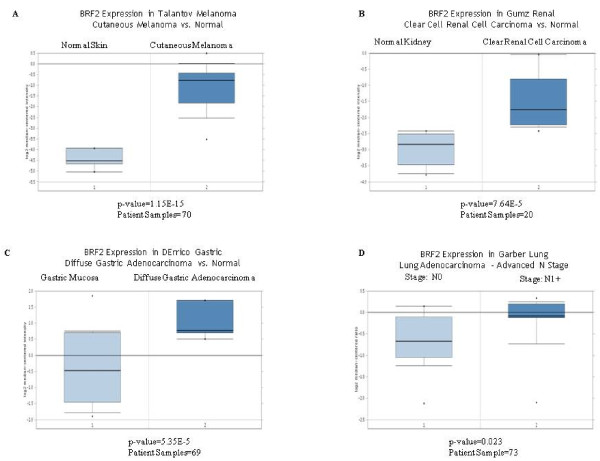
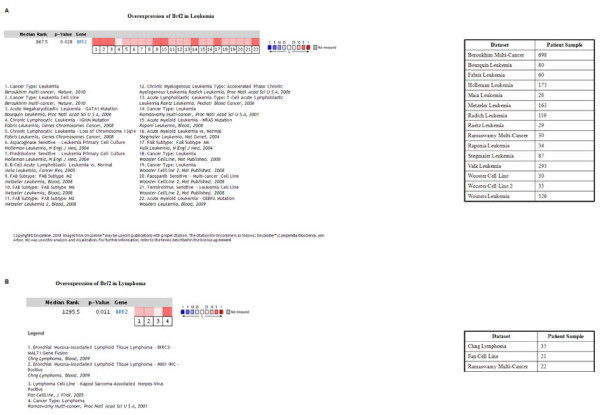
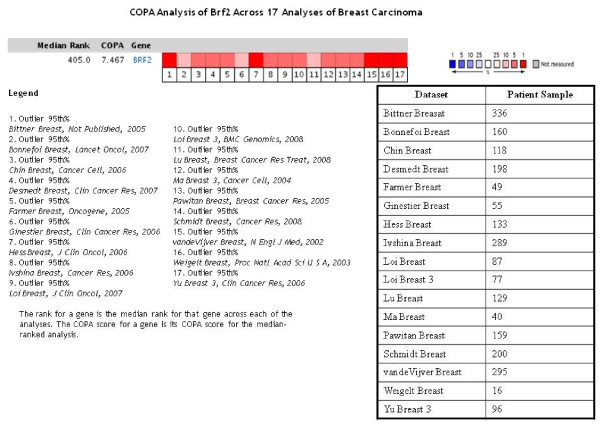
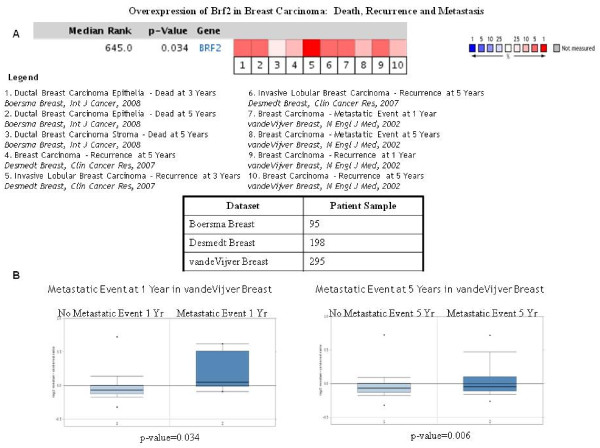
RNA polymerase (pol) III transcription is responsible for the transcription of small, untranslated RNAs involved in fundamental metabolic processes such mRNA processing (U6 snRNA) and translation (tRNAs). RNA pol III transcription contributes to the regulation of the biosynthetic capacity of a cell and a direct link exists between cancer cell proliferation and deregulation of RNA pol III transcription. Accurate transcription by RNA pol III requires TFIIIB, a known target of regulation by oncogenes and tumor suppressors. There have been significant advances in our understanding of how TFIIIB-mediated transcription is deregulated in a variety of cancers. Recently, BRF2, a component of TFIIIB required for gene external RNA pol III transcription, was identified as an oncogene in squamous cell carcinomas of the lung through integrative genomic analysis. In this review, we focus on recent advances demonstrating how BRF2-TFIIIB mediated transcription is regulated by tumor suppressors and oncogenes. Additionally, we present novel data further confirming the role of BRF2 as an oncogene, extracted from the Oncomine database, a cancer microarray database containing datasets derived from patient samples, providing evidence that BRF2 has the potential to be used as a biomarker for patients at risk for metastasis. This data further supports the idea that BRF2 may serve as a potential therapeutic target in a variety of cancers.


Figures

Figure 1
Figure 1
Gene internal and external TFIIIB. (A) Schematic of gene-internal TFIIIB (BRF1-TFIIIB) and gene-external human TFIIIB (BRF2-TFIIIB), note the difference in complexes is BRF1 and BRF2. (B) Schematic representation of TFIIB, BRF1 and BRF2 protein structures. Note the unrelated C-terminal extensions in the TFIIIB subunits BRF1 and BRF2. (Adapted from [2]).
Figure 2
Figure 2
BRF2-TFIIIB is a target of regulation by tumor suppressors and oncogenic products. Depiction of tumor suppressor and oncogenic products involved in the regulation of BRF2-TFIIIB. The tumor suppressors, p53, RB and BRCA1 are depicted as red circles. The oncogenic kinase CK2 is depicted by a green box and functions in regulating BRF2-TFIIIB. The stress related protein Maf1 is depicted by a triangle and functions in inhibiting BRF2-TFIIIB.
Figure 3
Figure 3
Oncomine Analysis: Disease Summary for BRF2. The Oncomine database was queried for BRF2 expression in the available datasets based on the following: cancer type, cancer versus normal, cancer versus cancer, cancer subtype, cancer versus baseline, pathway and drug and outlier analyses. The 'red cells' represents BRF2 overexpression and the 'blue cells' represent BRF2 underexpression. The levels of expression are based on the gene rank percentile. This disease summary was performed using a criterion of a 2 fold change for BRF2 expression and a p-value of 1E-4. Using these stringent criteria for BRF2 expression analysis, we found that BRF2 is highly overexpressed in the following cancer vs normal datasets: gastric, kidney and melanoma cancers. In the cancer vs cancer, multi-cancer datasets, BRF2 is overexpressed in leukemias and lymphomas. The outlier analysis, which is used to determine significant BRF2 expression in a subset of the patient samples, showed that BRF2 is both over- and under-expressed across the analyzed cancers. (Oncomine database).
Figure 4
Figure 4
Oncomine analysis of BRF2 expression in gastric, kidney, melanoma and lung cancers. As seen in Figure 3, BRF2 is significantly overexpressed in gastric, kidney and melanoma cancer datasets within the Oncomine datasets. We further queried Oncomine for each of these specific cancers to compare the fold change of BRF2 expression in the cancerous tissue compared to the controls for each specific cancer. All p-values represent a student's t-test. Figure 4A shows that BRF2 is overexpressed in cutaneous melanomas compared to normal skin in the Talantov Melanoma dataset [58]. BRF2 overexpression is significant with a p-value of 1.15E-15 and a total of 70 patient samples used for this analysis. Figure 4B shows that BRF2 is overexpressed in clear cell renal carcinoma compared to normal kidney in the Gumz Renal dataset [59]. BRF2 overexpression is significant with a p-value of 7.64E-5 and a total of 20 patient samples were used for this analysis. Figure 4C shows that BRF2 is overexpressed in diffuse gastric adenocarcinoma versus normal gastric mucosa in the DErrico Gastric dataset [60]. BRF2 overexpression is significant with a p-value of 5.35E-5 and a total of 69 patient samples were used for this analysis. Lastly, Figure 4D shows that BRF2 is overexpressed in advance N1+ stage lung adenocarcinoma compared to N0 stage in the Garber Lung Adenocarcinoma dataset [61]. BRF2 overexpression is significant with a p-value of 0.023 and a total of 73 patient samples were analyzed. (Oncomine database).
Figure 5
Figure 5
Oncomine analysis of BRF2 expression in leukemia and lymphoma. As demonstrated in Figure 3, BRF2 is overexpressed in both leukemia and lymphoma, cancer vs cancer datasets. We further queried the Oncomine database to analyze BRF2 expression in both leukemia and lymphoma. Figure 5A represents an analysis performed across 22 leukemia analyses found within Oncomine. The p-value, 0.028, represents a student's t-test measuring BRF2 overexpression in cancerous tissues, and the red represents significant overexpression. This analysis shows that BRF2 is significantly overexpressed across leukemia. The table states the datasets analyzed and the number of patient samples used in each study. Figure 5B represents an analysis performed across 4 lymphoma analyses found within Oncomine. The p-value, 0.011, represents a student's t-test measuring BRF2 overexpression in cancerous tissue and the red represents significant overexpression. This analysis shows that BRF2 is significantly overexpressed across lymphoma. The table states the datasets used for analysis and the number of patient samples used in each study. (Oncomine database).
Figure 6
Figure 6
Oncomine analysis of BRF2 expression in breast carcinoma using COPA. As seen in Figure 3, BRF2 was overexpressed in a total of 50 analyses using an outlier analysis. COPA (cancer outlier profile analysis) analyzes a small subpopulation of samples which represent outliers within the datasets for significant expression and does not represent the majority of samples. We investigated BRF2 expression in several breast carcinoma studies based on the high number of analyses BRF2 was overexpressed in using COPA (Figure 3). Based on the COPA method, BRF2 is highly overexpressed across 17 breast carcinoma analyses in a subset of the patient samples used for each respective analysis. The red represents significant overexpression. The datasets used for this analysis and the number of patient samples used in each individual study are shown as well. (Oncomine database).
Figure 7
Figure 7
Oncomine analysis: BRF2 overexpression and clinical outcome. To determine if BRF2 overexpression correlated with patient outcome in the clinic, we performed further analysis using Oncomine datasets focused on breast carcinoma studies analyzing patient death, recurrence and metastasis. Figure 7A shows that BRF2 is overexpressed across 10 breast carcinoma analyses which focused on patient recurrence at 3 and 5 years; metastasis at 1 and 5 years; and patient death at 3 and 5 years. The p-value, 0.034, represents a student's t-test measuring BRF2 overexpression in the analyzed datasets and the red represents significant overexpression of BRF2. Overall, there is a correlation with BRF2 overexpression and death, recurrence and metastasis in patients diagnosed with breast carcinoma. The datasets used for this analysis and the number of patient samples used in each individual study are shown as well. To further analyze BRF2 overexpression and the correlation with metastasis, we used the vandeVijver breast carcinoma study, (295 patient samples analyzed). Figure 7B demonstrates that in patients presenting with metastasis at 1 and 5 years, there is significant overexpression of BRF2, p-value 0.034 and 0.006 respectively, in comparison to patients with no metastasis. (Oncomine database).

Similar articles

Cited by

References

    1. Jemal A, Siegel R, Ward E, Hao Y, Xu J, Thun MJ. Cancer statistics, 2009. CA Cancer J Clin. 2009;59(4):225–49. doi: 10.3322/caac.20006. - DOI - PubMed
    1. Schramm L, Hernandez N. Recruitment of RNA polymerase III to its target promoters. Genes Dev. 2002;16(20):2593–620. doi: 10.1101/gad.1018902. - DOI - PubMed
    1. Huang Y, Maraia RJ. Comparison of the RNA polymerase III transcription machinery in Schizosaccharomyces pombe, Saccharomyces cerevisiae and human. Nucleic Acids Res. 2001;29(13):2675–90. doi: 10.1093/nar/29.13.2675. - DOI - PMC - PubMed
    1. Geiduschek EP, Kassavetis GA. The RNA polymerase III transcription apparatus. J Mol Biol. 2001;310(1):1–26. doi: 10.1006/jmbi.2001.4732. - DOI - PubMed
    1. Dieci G, Fiorino G, Castelnuovo M, Teichmann M, Pagano A. The expanding RNA polymerase III transcriptome. Trends Genet. 2007;23(12):614–22. doi: 10.1016/j.tig.2007.09.001. - DOI - PubMed

Publication types

LinkOut - more resources