

Macrophage migration inhibitory factor: a downregulator of early T cell-dependent IFN-gamma responses in Plasmodium chabaudi adami (556 KA)-infected mice
- PMID: 21518974
- PMCID: PMC3390021
- DOI: 10.4049/jimmunol.1003355
Macrophage migration inhibitory factor: a downregulator of early T cell-dependent IFN-gamma responses in Plasmodium chabaudi adami (556 KA)-infected mice
Abstract
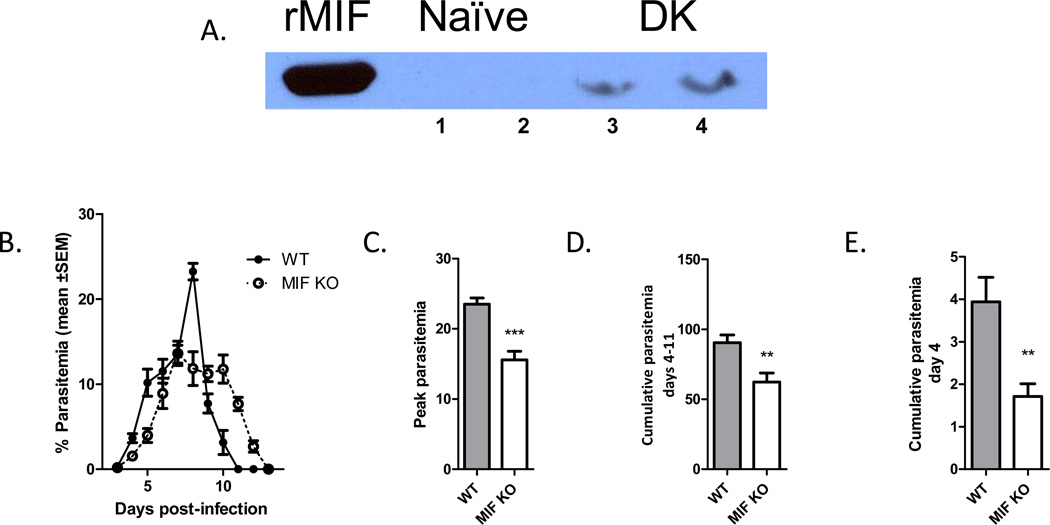
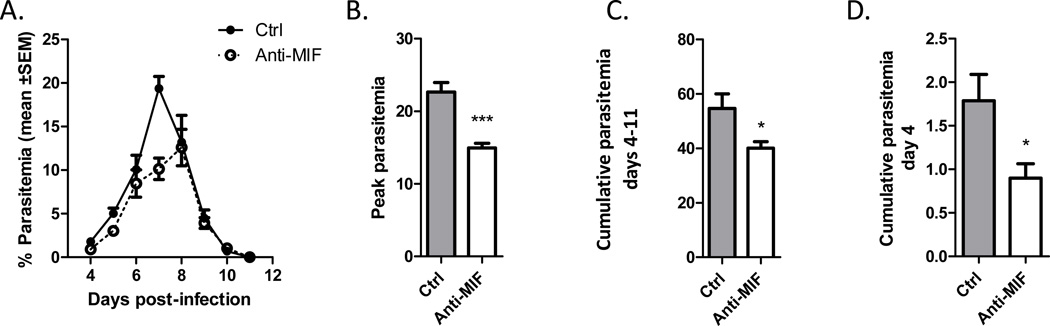
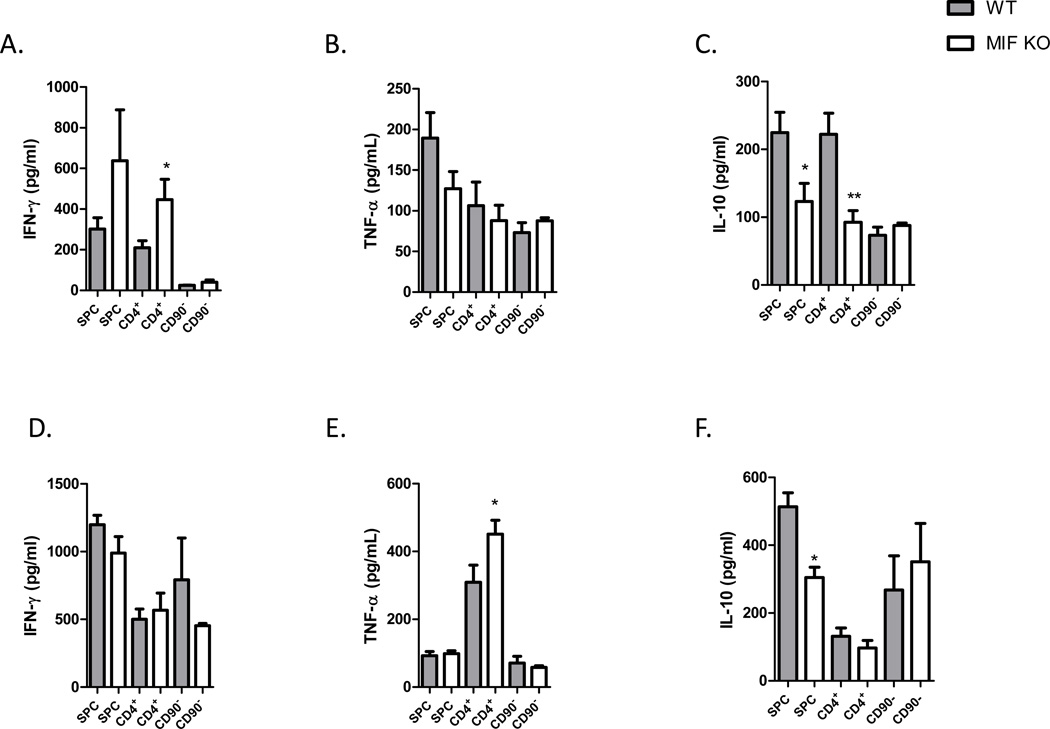
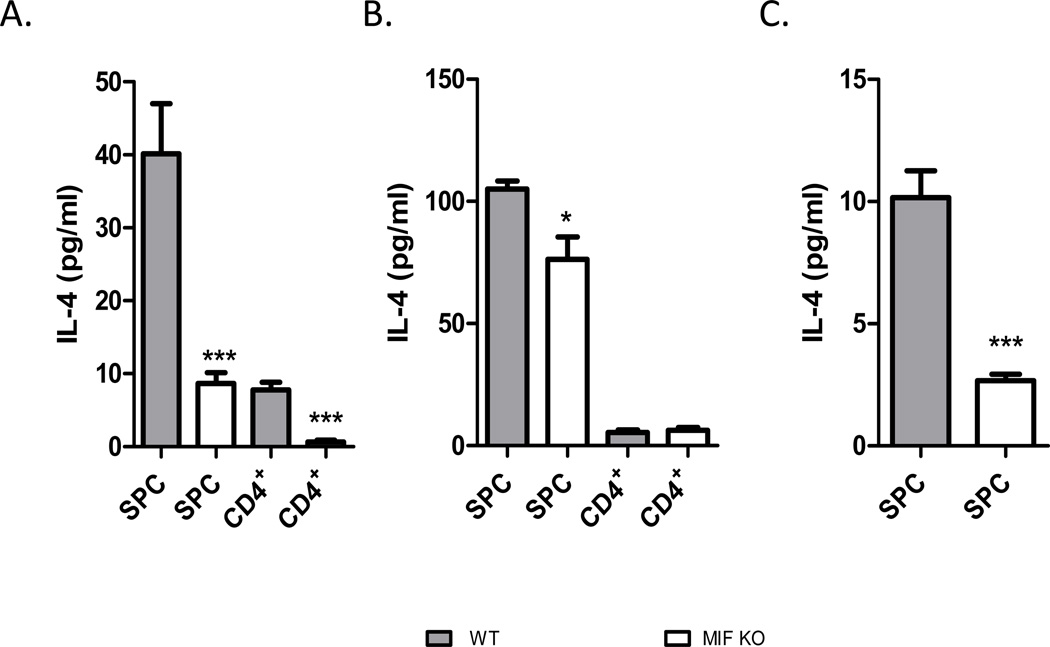
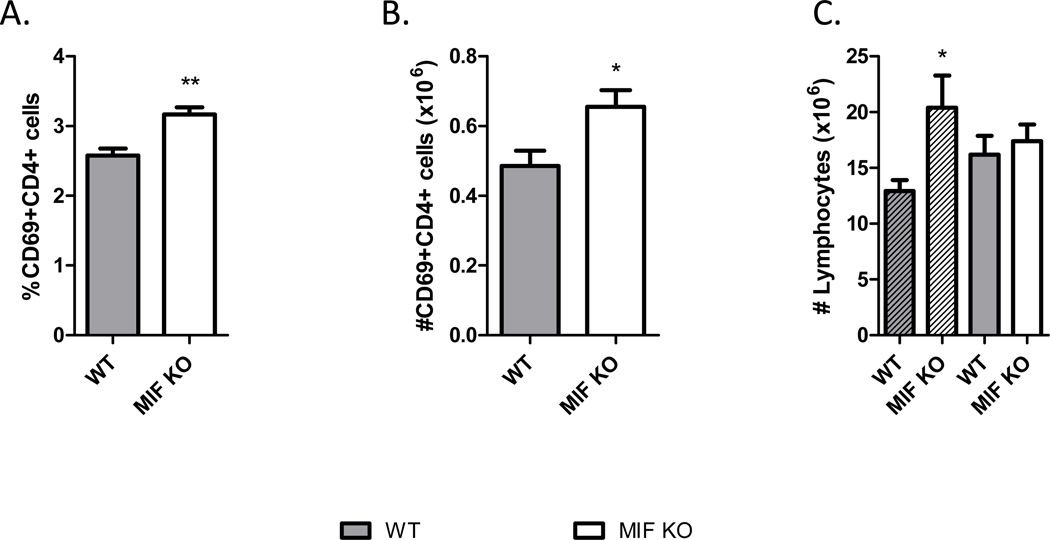
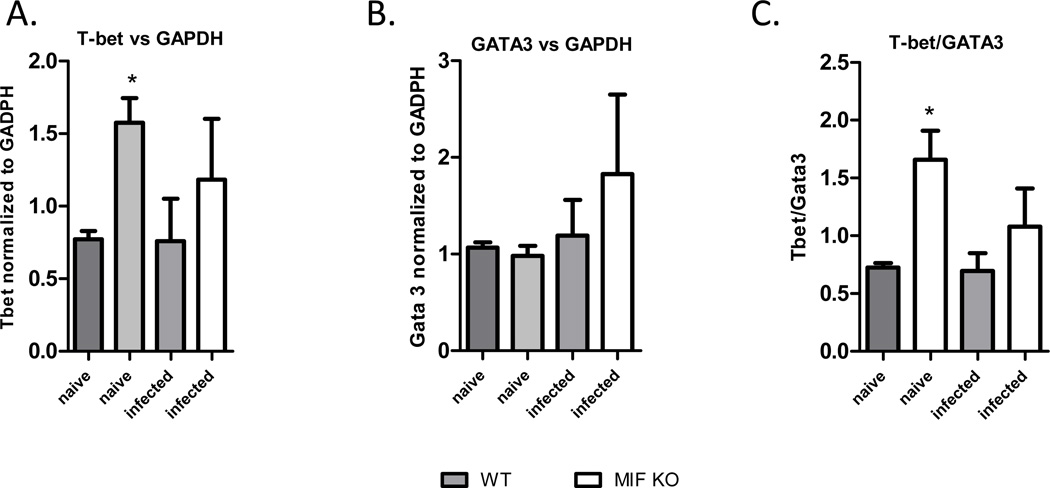
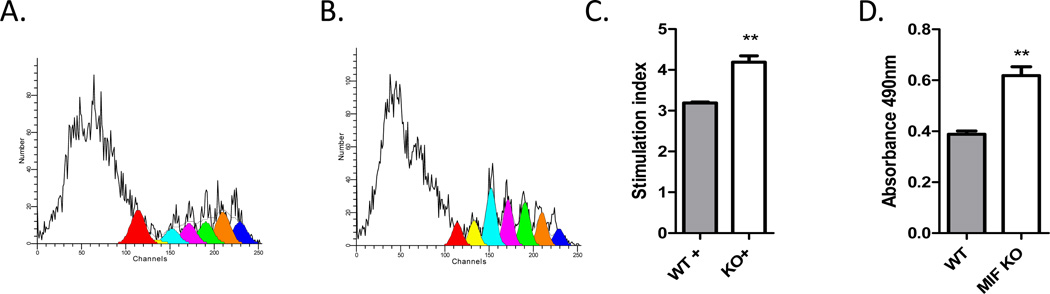
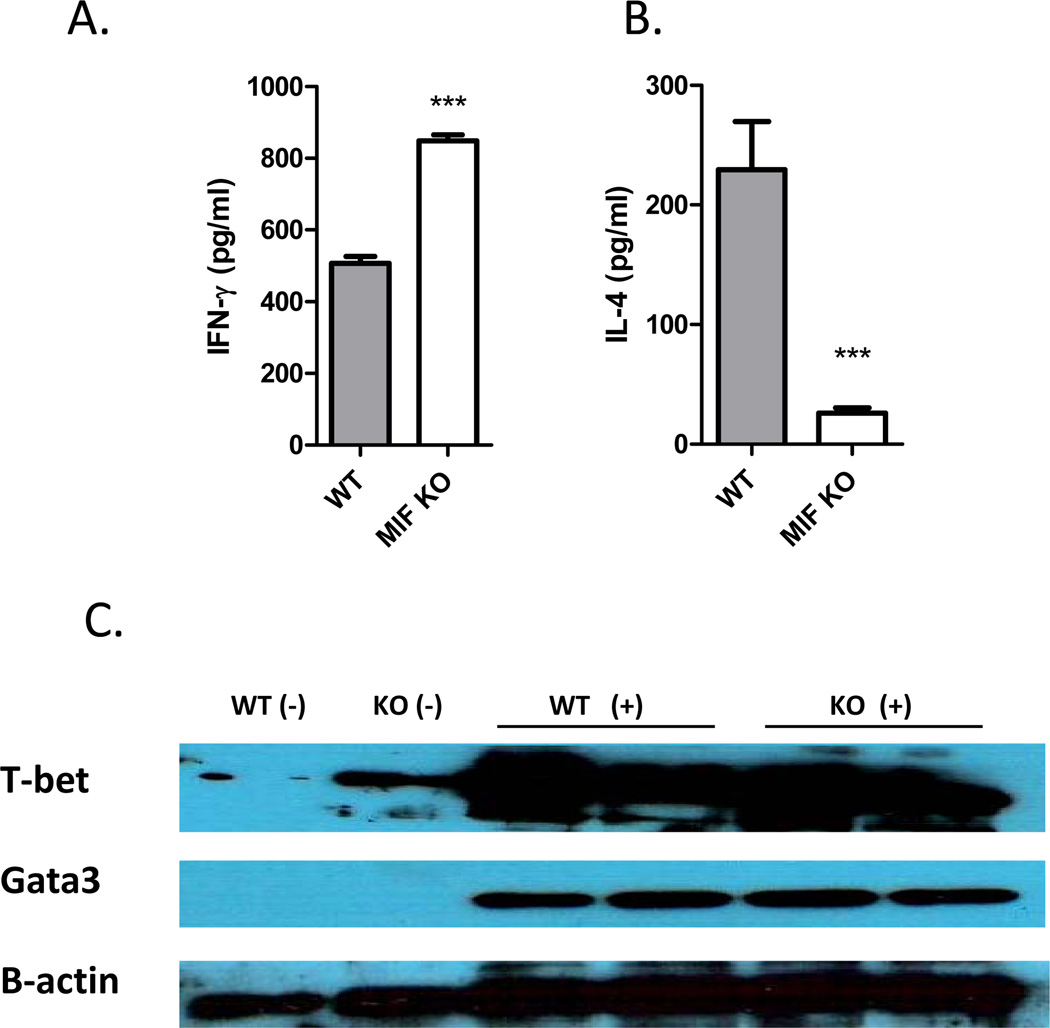
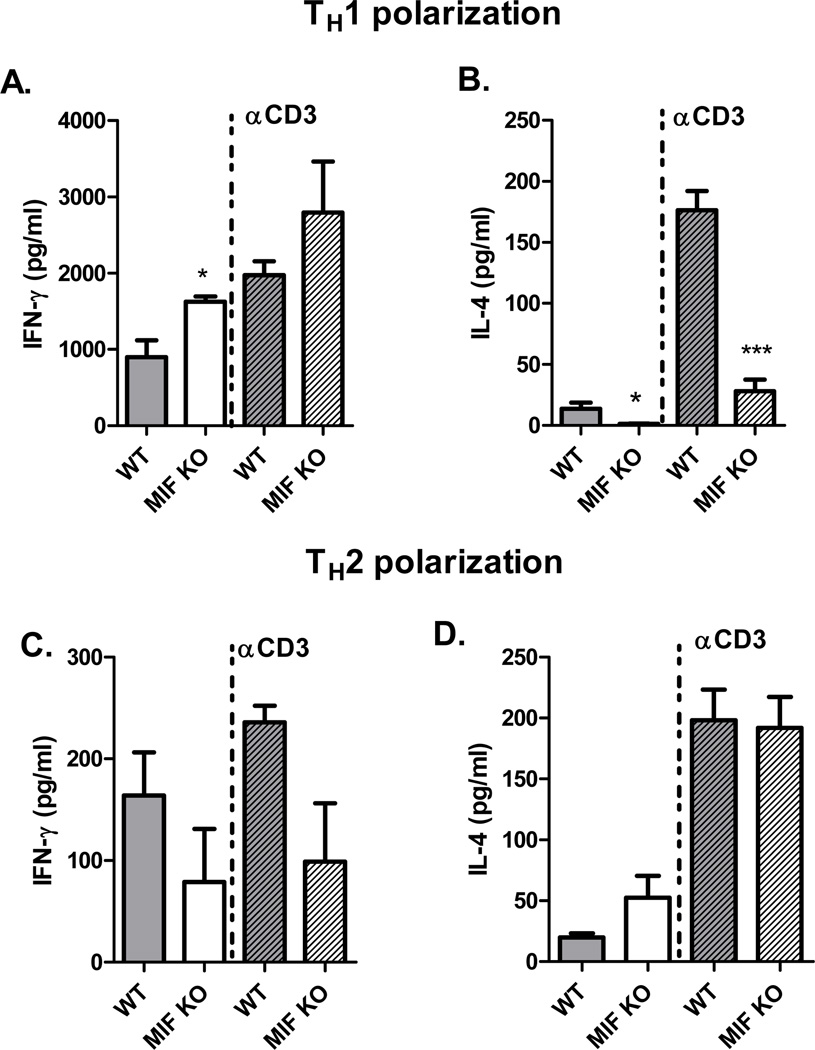
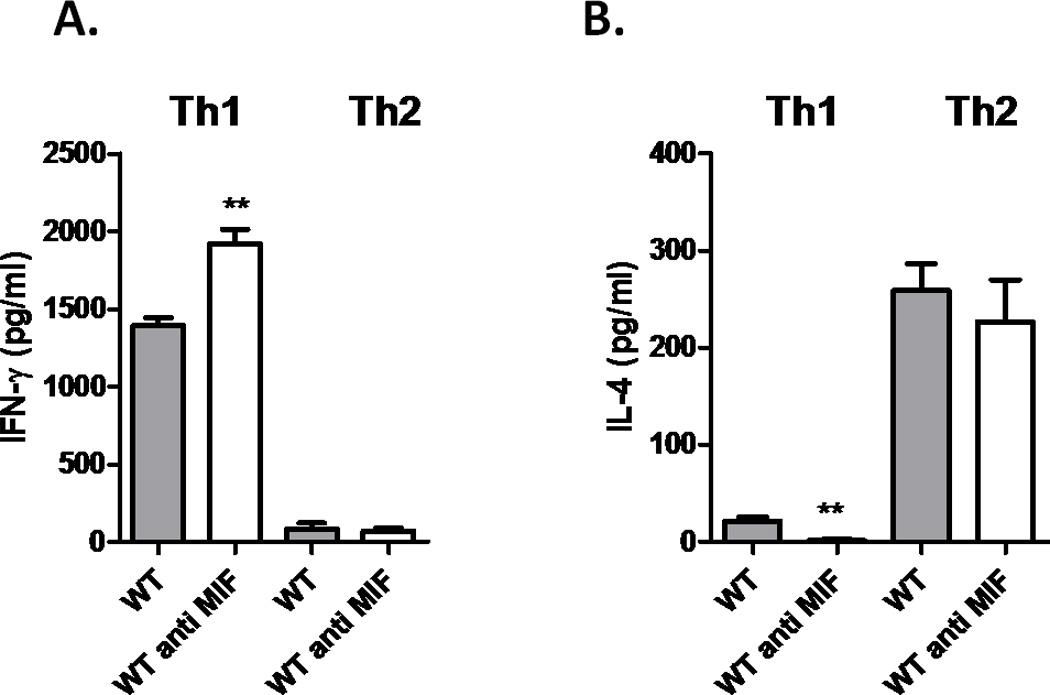
Neutralization of macrophage migration inhibitory factor (MIF) increases anti-tumor cytotoxic T cell responses in vivo and IFN-γ responses in vitro, suggesting a plausible regulatory role for MIF in T cell activation. Considering that IFN-γ production by CD4(+) T cells is pivotal to resolve murine malaria and that secretion of MIF is induced by Plasmodium chabaudi adami parasites, we investigated the effect of MIF deficiency on the infection with this pathogen. Infections with P. c. adami 556 KA parasites were more efficiently controlled in MIF-neutralized and MIF-deficient (knockout [KO]) BALB/c mice. The reduction in parasitemia was associated with reduced production of IL-4 by non-T/non-B cells throughout patent infection. At day 4 postinfection, higher numbers of activated CD4(+) cells were measured in MIF KO mice, which secreted more IFN-γ, less IL-4, and less IL-10 than did CD4(+) T cells from wild-type mice. Enhanced IFN-γ and decreased IL-4 responses also were measured in MIF KO CD4(+) T cells stimulated with or without IL-12 and anti-IL-4 blocking Ab to induce Th1 polarization. However, MIF KO CD4(+) T cells efficiently acquired a Th2 phenotype when stimulated in the presence of IL-4 and anti-IL-12 Ab, indicating normal responsiveness to IL-4/STAT6 signaling. These results suggest that by promoting IL-4 responses in cells other than T/B cells during early P. c. adami infection, MIF decreases IFN-γ secretion in CD4(+) T cells and, additionally, has the intrinsic ability to render CD4(+) T cells less capable of acquiring a robust Th1 phenotype when stimulated in the presence of IL-12.
Figures
Similar articles
-
Natural regulatory (CD4+CD25+FOXP+) T cells control the production of pro-inflammatory cytokines during Plasmodium chabaudi adami infection and do not contribute to immune evasion.Int J Parasitol. 2008 Feb;38(2):229-38. doi: 10.1016/j.ijpara.2007.07.006. Epub 2007 Jul 26. Int J Parasitol. 2008. PMID: 17868677
-
Anti-IL-2 treatment impairs the expansion of T(reg) cell population during acute malaria and enhances the Th1 cell response at the chronic disease.PLoS One. 2012;7(1):e29894. doi: 10.1371/journal.pone.0029894. Epub 2012 Jan 17. PLoS One. 2012. PMID: 22272258 Free PMC article.
-
IL-2 contributes to maintaining a balance between CD4+Foxp3+ regulatory T cells and effector CD4+ T cells required for immune control of blood-stage malaria infection.J Immunol. 2011 Apr 15;186(8):4862-71. doi: 10.4049/jimmunol.1003777. Epub 2011 Mar 9. J Immunol. 2011. PMID: 21389253
-
Dendritic cells, pro-inflammatory responses, and antigen presentation in a rodent malaria infection.Immunol Rev. 2004 Oct;201:35-47. doi: 10.1111/j.0105-2896.2004.00182.x. Immunol Rev. 2004. PMID: 15361231 Review.
-
Role of interleukin-10 in malaria: focusing on coinfection with lethal and nonlethal murine malaria parasites.J Biomed Biotechnol. 2011;2011:383962. doi: 10.1155/2011/383962. Epub 2011 Nov 13. J Biomed Biotechnol. 2011. PMID: 22190849 Free PMC article. Review.
Cited by
-
Macrophage migration inhibitory factor (MIF): a key player in protozoan infections.Int J Biol Sci. 2011;7(9):1239-56. doi: 10.7150/ijbs.7.1239. Epub 2011 Oct 25. Int J Biol Sci. 2011. PMID: 22110378 Free PMC article. Review.
-
Macrophage migration inhibitory factor contributes to immunopathogenesis during Plasmodium yoelii 17XL infection.Front Cell Infect Microbiol. 2022 Aug 24;12:968422. doi: 10.3389/fcimb.2022.968422. eCollection 2022. Front Cell Infect Microbiol. 2022. PMID: 36093199 Free PMC article.
-
Paradoxical sleep deprivation impairs mouse survival after infection with malaria parasites.Malar J. 2015 Apr 28;14:183. doi: 10.1186/s12936-015-0690-7. Malar J. 2015. PMID: 25927919 Free PMC article.
-
Preconditioning with hemin decreases Plasmodium chabaudi adami parasitemia and inhibits erythropoiesis in BALB/c mice.PLoS One. 2013;8(1):e54744. doi: 10.1371/journal.pone.0054744. Epub 2013 Jan 24. PLoS One. 2013. PMID: 23358441 Free PMC article.
-
Macrophage migration inhibitory factor in protozoan infections.J Parasitol Res. 2012;2012:413052. doi: 10.1155/2012/413052. Epub 2012 Feb 9. J Parasitol Res. 2012. PMID: 22496958 Free PMC article.
References
Publication types
MeSH terms
Substances
Grants and funding
LinkOut - more resources
Full Text Sources
Medical
Molecular Biology Databases
Research Materials
Miscellaneous
