

Histone deacetylase inhibitors, valproic acid and trichostatin-A induce apoptosis and affect acetylation status of p53 in ERG-positive prostate cancer cells
- PMID: 21519790
- PMCID: PMC3329756
- DOI: 10.3892/ijo.2011.1014
Histone deacetylase inhibitors, valproic acid and trichostatin-A induce apoptosis and affect acetylation status of p53 in ERG-positive prostate cancer cells
Abstract
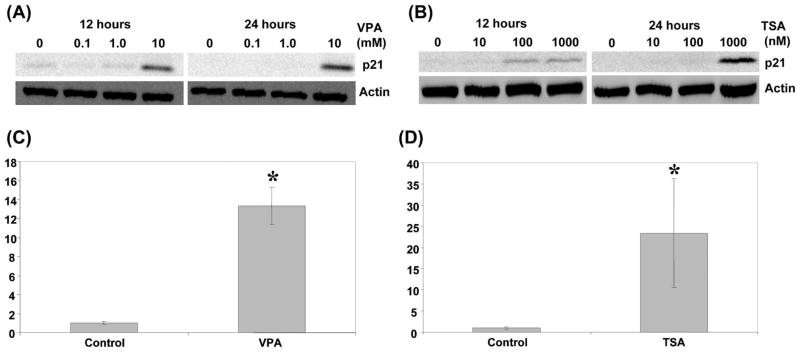
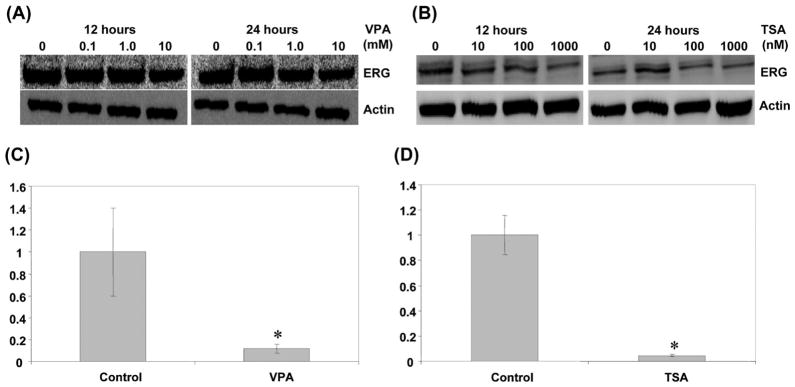
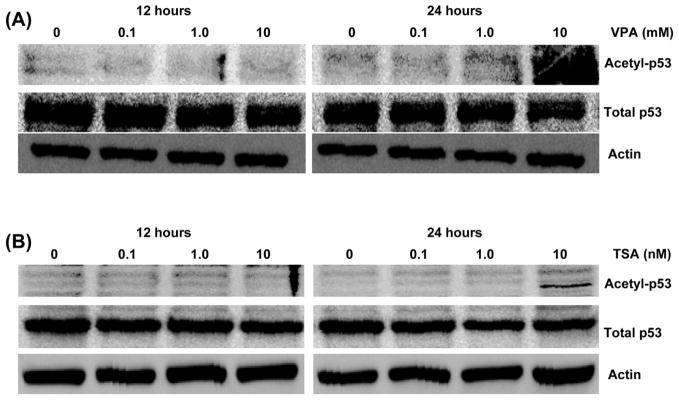
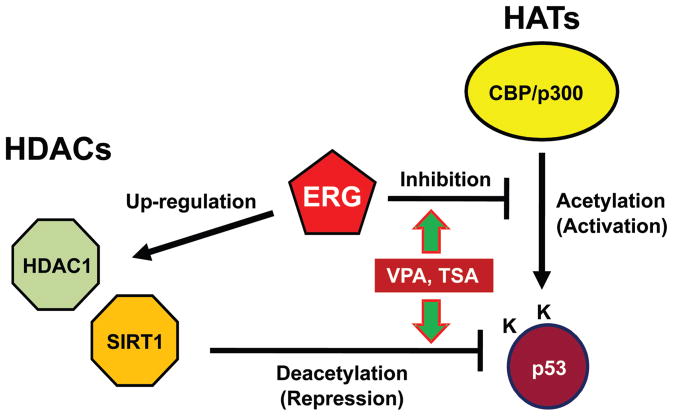
An ETS family member, ETS Related Gene (ERG) is involved in the Ewing family of tumors as well as leukemias. Rearrangement of the ERG gene with the TMPRSS2 gene has been identified in the majority of prostate cancer patients. Additionally, overexpression of ERG is associated with unfavorable prognosis in prostate cancer patients similar to leukemia patients. Histone acetyltransferases (HATs) and histone deacetylases (HDACs) regulate transcription as well as epigenetic status of genes through acetylation of both histones and transcription factors. Deregulation of HATs and HDACs is frequently seen in various cancers, including prostate cancer. Many cellular oncogenes as well as tumor viral proteins are known to target either or both HATs and HDACs. Several studies have demonstrated that there are alterations of HDAC activity in prostate cancer cells. Recently, we found that ERG binds and inhibits HATs, which suggests that ERG is involved in deregulation of protein acetylation. Additionally, it has been shown that ERG is associated with a higher expression of HDACs. In this study, we tested the effect of the HDAC inhibitors valproic acid (VPA) and trichostatin-A (TSA) on ERG-positive prostate cancer cells (VCaP). We found that VPA and TSA induce apoptosis, upregulate p21/Waf1/CIP1, repress TMPRSS2-ERG expression and affect acetylation status of p53 in VCaP cells. These results suggest that HDAC inhibitors might restore HAT activity through two different ways: by inhibiting HDAC activity and by repressing HAT targeting oncoproteins such as ERG.
Figures
Similar articles
-
Defining the molecular action of HDAC inhibitors and synergism with androgen deprivation in ERG-positive prostate cancer.Int J Cancer. 2008 Dec 15;123(12):2774-81. doi: 10.1002/ijc.23885. Int J Cancer. 2008. PMID: 18798265
-
Expressional changes after histone deacetylase inhibition by valproic acid in LNCaP human prostate cancer cells.Int J Oncol. 2004 Jan;24(1):25-31. Int J Oncol. 2004. PMID: 14654937
-
Novel histone deacetylase inhibitor CG200745 induces clonogenic cell death by modulating acetylation of p53 in cancer cells.Invest New Drugs. 2012 Apr;30(2):435-42. doi: 10.1007/s10637-010-9568-2. Epub 2010 Oct 27. Invest New Drugs. 2012. PMID: 20978925
-
HDACs and HDAC Inhibitors in Cancer Development and Therapy.Cold Spring Harb Perspect Med. 2016 Oct 3;6(10):a026831. doi: 10.1101/cshperspect.a026831. Cold Spring Harb Perspect Med. 2016. PMID: 27599530 Free PMC article. Review.
-
Anticancer clinical efficiency and stochastic mechanisms of belinostat.Biomed Pharmacother. 2023 Sep;165:115212. doi: 10.1016/j.biopha.2023.115212. Epub 2023 Aug 2. Biomed Pharmacother. 2023. PMID: 37541175 Review.
Cited by
-
Anti-Epileptic Drug Targets Ewing Sarcoma.J Pharm Sci Pharmacol. 2014 Jun 1;1(2):87-100. doi: 10.1166/jpsp.2014.1013. J Pharm Sci Pharmacol. 2014. PMID: 25664332 Free PMC article.
-
Salvage therapy with azacitidine for pediatric acute myeloid leukemia with t(16;21)(p11;q22)/FUS-ERG and early relapse after allogeneic blood stem cell transplantation: A case report.Clin Case Rep. 2019 Sep 27;7(11):2149-2152. doi: 10.1002/ccr3.2461. eCollection 2019 Nov. Clin Case Rep. 2019. PMID: 31788268 Free PMC article.
-
The oncogene ERG: a key factor in prostate cancer.Oncogene. 2016 Jan 28;35(4):403-14. doi: 10.1038/onc.2015.109. Epub 2015 Apr 27. Oncogene. 2016. PMID: 25915839 Review.
-
Repurposing Old Drugs into New Epigenetic Inhibitors: Promising Candidates for Cancer Treatment?Pharmaceutics. 2020 Apr 29;12(5):410. doi: 10.3390/pharmaceutics12050410. Pharmaceutics. 2020. PMID: 32365701 Free PMC article. Review.
-
Effect of vorinostat on INK4 family and HDACs 1, 2, and 3 in pancreatic cancer and hepatocellular carcinoma.Res Pharm Sci. 2021 May 12;16(3):260-268. doi: 10.4103/1735-5362.314824. eCollection 2021 Jun. Res Pharm Sci. 2021. PMID: 34221059 Free PMC article.
References
-
- Rao VN, Papas TS, Reddy ES. erg, a human ets-related gene on chromosome 21: alternative splicing, polyadenylation, and translation. Science. 1987;237:635–639. - PubMed
-
- Reddy ES, Rao VN. erg, an ets-related gene, codes for sequence-specific transcriptional activators. Oncogene. 1991;6:2285–2289. - PubMed
-
- Siddique HR, Rao VN, Lee L, Reddy ES. Characterization of the DNA binding and transcriptional activation domains of the erg protein. Oncogene. 1993;8:1751–1755. - PubMed
Publication types
MeSH terms
Substances
Grants and funding
- U54 MD007588/MD/NIMHD NIH HHS/United States
- U54 CA118638/CA/NCI NIH HHS/United States
- G12 RR003034/RR/NCRR NIH HHS/United States
- P30 CA013148/CA/NCI NIH HHS/United States
- G12 MD007585/MD/NIMHD NIH HHS/United States
- R25 GM058268/GM/NIGMS NIH HHS/United States
- 2U54CA118948/CA/NCI NIH HHS/United States
- S21 MD000101/MD/NIMHD NIH HHS/United States
- U54 RR026137/RR/NCRR NIH HHS/United States
- U54CA118638-05S1/CA/NCI NIH HHS/United States
- U54 CA118623/CA/NCI NIH HHS/United States
- U54 CA118948/CA/NCI NIH HHS/United States
LinkOut - more resources
Full Text Sources
Medical
Research Materials
Miscellaneous
