
The neuronal transporter gene SLC6A15 confers risk to major depression

Martin A Kohli et al. Neuron. .

Abstract

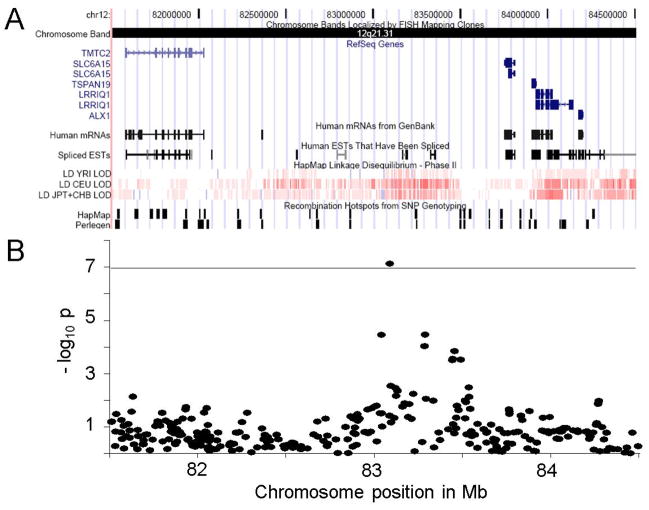
Major depression (MD) is one of the most prevalent psychiatric disorders and a leading cause of loss in work productivity. A combination of genetic and environmental risk factors probably contributes to MD. We present data from a genome-wide association study revealing a neuron-specific neutral amino acid transporter (SLC6A15) as a susceptibility gene for MD. Risk allele carrier status in humans and chronic stress in mice were associated with a downregulation of the expression of this gene in the hippocampus, a brain region implicated in the pathophysiology of MD. The same polymorphisms also showed associations with alterations in hippocampal volume and neuronal integrity. Thus, decreased SLC6A15 expression, due to genetic or environmental factors, might alter neuronal circuits related to the susceptibility for MD. Our convergent data from human genetics, expression studies, brain imaging, and animal models suggest a pathophysiological mechanism for MD that may be accessible to drug targeting.


Figures

Fig. 1
Fig. 1. Genomic context of the associated region on 12q21.31
(A) Relevant features of the genomic architecture of a 3 Mb region comprising the 450 kb region of association with MD according to the UCSC Genome Browser: RefSeq annotated genes (blue), human mRNAs and expressed sequence tags from GenBank (black), HapMap Linkage Disequilibrium (red: high LD, white: low LD) and hotspots of homologous recombination from SNP genotyping data provided by HapMap and Perlegen (black). The associated region did not map to any known gene (compare with 2B). The flanking next genes to the region of association are SLC6A15 (+287 kb), a solute carrier family 6 gene that codes for a sodium-dependent branched amino acid transporter with high gene expression in neurons of the brain and TMTC2 (−989 kb), the transmembrane and tetratricopeptide repeat containing 2 gene of unknown function (see also tab. S1). (B) The negative common logarithm (−log10) of the best model p-values (y-axis) of all tested SNPs in the shown region from genome-wide case-control association testing in the discovery sample were plotted against the SNP’s chromosome positions (x-axis). The horizontal line across the figure indicates the genome-wide significance level of the experiment. The dot above this line represents the -log10 p-value of rs1545843. The corresponding Manhatten plot over all tested SNPs and chromosomes is shown in fig. S2.
Fig. 2
Fig. 2
LD structure of the 8 SNPs associated with MD on 12q21.31 is presented in (A) German controls of the GWAS in MD (N=366); and (B) in the African-American control sample (BDI<14, N=284). Pairwise r-squared values multiplied with 100 are shown for each SNP pair. rs1545843 (SNP 2) which reached experiment-wide significance in the GWAS, is in medium LD with the other seven associated SNPs in Europeans, but in low LD in African-Americans (SNP 1).
Fig. 3
Fig. 3. Forest plot of the combined meta-analysis over six independent studies
rs1545843 remained genome-wide significantly associated with MD in the meta-analysis after replication round 1 under the recessive model (AA vs. AG+GG, see tab. 1). This association was further replicated in the RANDIANT/WTCCC2 sample. The combined meta-analysis p-value over a total of 7 samples was 1.41e-09. MARS: The Munich antidepressant response signature study, the German GWAS discovery case-control MD sample (N=353/366). Munich recurrent depression: The Southern German recurrent depression and control replication sample (N=917/1022). ERF: The Dutch Erasmus Rucphen Family study MD case-control subsample (N=283/290) Emory: The African-American MD case-control subsample from Emory University in Atlanta (N=307/684). Bonn: West German MD case-control replication sample (N=292/1157)(Rietschel et al., 2010). MARS2: Additional MD cases and controls from the MARS study which were recruited after the GWAS (N=300/236). RADIANT/WTCCC2: UK-cases and controls of the RADIANT study and additional controls from the WTCCC2 cohorts (N=1636/7246).
Fig. 4
Fig. 4
SLC6A15 mRNA expression per rs1545843 genotype group measured in pre-mortem human hippocampus from individuals with temporal lobe epilepsy of European descent. (A) The MD risk genotype (AA) is associated with reduced full-length (FL, red boxes in part B) SLC6A15 mRNA expression levels compared to the non-risk genotypes (AG+GG). None of the other genes flanking the region of association with MD showed experiment-wide significant rs1545843 genotype-specific alterations in expression levels. SLC6A15 S: Short mRNA isoform of SLC6A15; (B) Box plot diagrams of FL (red) and S (blue) SLC6A15 mRNA expression levels in human hippocampus. On the x-axis the 3 genotype groups of rs1545843 are plotted against normalized SLC6A15 mRNA levels on the y-axis (group means: solid horizontal lines). Blue box-plots depict the expression levels of the short SLC6A15 isoform (S) and red plots expression levels of the full-length (FL) SLC6A15 transcript. For results of an analogues eQTL analysis in lymphoblastoid cell lines of HapMap individuals see supplemental fig. S3.
Fig. 5
Fig. 5. NMR imaging: Genotype-by-diagnosis interaction effects on hippocampal volume
(a) Based on cytoarchitectonic probability maps, automated volumetry of grey matter (GM) of the total hippocampus (cornu ammonis, subiculum and dentate gyrus) and respective subregions was performed in 390 subjects after optimized segmentation and coregistration. The resulting maximum probability maps projected on a standard brain template in atlas space are shown. (b) Results of the left total hippocampal GM: Bars show adjusted mean values and one standard error of the mean for the main effect of diagnosis and the rs1545843 genotype (AA vs. AG/GG) × diagnosis interaction effect. Lowest mean volumes were seen for patients with the AA genotype. (c) Corresponding depiction for the left cornu ammonis (* nominal p<0.05, ** Bonferroni corrected p<0.05.). Results of other subregions and of right hemisphere are reported in tab. S2.
Fig. 6
Fig. 6. Reduced hippocampal SLC6A15 mRNA expression in stress susceptible mice
(A) The significant reduction in SLC6A15 mRNA levels in the CA1 hippocampal region between stress resilient (R) and susceptible (S) mice detected by microarray analysis could be confirmed by in situ hybridisation (N=9/9, −2.1-fold reduction). (B) Two representative autoradiographs of hippocampal slices from one animal per group are shown. (C,D) SLC6A15 mRNA was also significantly reduced in the dentate gyrus (DG, −1.5-fold) and by trend reduced in the visual cortex (Cx, −1.7-fold). + P<0.06; **P<0.01; ***P<0.001. See also fig. S5 for description of the mouse model and tab. S3 for microarray results.

Comment in

References

    1. Allen Brain Atlas. Seattle (WA): Allen Institute for Brain Science; © 2008 Available from: http://www.brain-map.org.
    1. Alexopoulos GS. The vascular depression hypothesis: 10 years later. Biol Psychiatry. 2006;60:1304–1305. - PubMed
    1. Amunts K, Kedo O, Kindler M, Pieperhoff P, Mohlberg H, Shah NJ, Habel U, Schneider F, Zilles K. Cytoarchitectonic mapping of the human amygdala, hippocampal region and entorhinal cortex: intersubject variability and probability maps. Anatomy And Embryology. 2005;210:343–352. - PubMed
    1. Aulchenko YS, Heutink P, Mackay I, Bertoli-Avella AM, Pullen J, Vaessen N, Rademaker TA, Sandkuijl LA, Cardon L, Oostra B, van Duijn CM. Linkage disequilibrium in young genetically isolated Dutch population. Eur J Hum Genet. 2004;12:527–534. - PubMed
    1. Barrett JC, Fry B, Maller J, Daly MJ. Haploview: analysis and visualization of LD and haplotype maps. Bioinformatics. 2005;21:263–265. - PubMed

Publication types

MeSH terms

Associated data