. 2011 Jul;21(7):1099-108.
doi: 10.1101/gr.115998.110. Epub 2011 Apr 26.

Association studies for next-generation sequencing

Affiliations

Association studies for next-generation sequencing

Li Luo et al. Genome Res. 2011 Jul.

Abstract

Genome-wide association studies (GWAS) have become the primary approach for identifying genes with common variants influencing complex diseases. Despite considerable progress, the common variations identified by GWAS account for only a small fraction of disease heritability and are unlikely to explain the majority of phenotypic variations of common diseases. A potential source of the missing heritability is the contribution of rare variants. Next-generation sequencing technologies will detect millions of novel rare variants, but these technologies have three defining features: identification of a large number of rare variants, a high proportion of sequence errors, and a large proportion of missing data. These features raise challenges for testing the association of rare variants with phenotypes of interest. In this study, we use a genome continuum model and functional principal components as a general principle for developing novel and powerful association analysis methods designed for resequencing data. We use simulations to calculate the type I error rates and the power of nine alternative statistics: two functional principal component analysis (FPCA)-based statistics, the multivariate principal component analysis (MPCA)-based statistic, the weighted sum (WSS), the variable-threshold (VT) method, the generalized T(2), the collapsing method, the CMC method, and individual tests. We also examined the impact of sequence errors on their type I error rates. Finally, we apply the nine statistics to the published resequencing data set from ANGPTL4 in the Dallas Heart Study. We report that FPCA-based statistics have a higher power to detect association of rare variants and a stronger ability to filter sequence errors than the other seven methods.


Figures

Figure 1.
Figure 1.
Power of nine statistics: FPCA (discretization approach)–based statistics, FPCA (Fourier expansion approach)–based statistic, multivariate PC–based statistic, WSS, VT, collapsing method, generalized T2 statistic, single marker χ2 test, and CMC method (the variants with frequencies ≤ 0.005 were collapsed) as a function of proportion of risk-increasing variants for testing association of 22 rare variants with the disease under the additive disease model, assuming baseline penetrance of 0.01, 2000 cases, and 2000 controls.
Figure 2.
Figure 2.
Power of nine statistics: FPCA (discretization approach)–based statistics, FPCA (Fourier expansion approach)–based statistic, multivariate PC–based statistic, WSS, VT, collapsing method, generalized T2 statistic, single marker χ2 test, and CMC method (the variants with frequencies ≤ 0.005 were collapsed) as a function of proportion of risk-increasing variants for testing association of 22 rare variants with the disease under the dominant disease model, assuming baseline penetrance of 0.01, 2000 cases, and 2000 controls.
Figure 3.
Figure 3.
Power of nine statistics: FPCA (discretization approach)–based statistics, FPCA (Fourier expansion approach)–based statistic, multivariate PC–based statistic, WSS, VT, collapsing method, generalized T2 statistic, single marker χ2 test, and CMC method (the variants with frequencies ≤ 0.005 were collapsed) as a function of proportion of risk-increasing variants for testing association of 22 rare variants with the disease under the multiplicative disease model, assuming baseline penetrance of 0.01, 2000 cases, and 2000 controls.
Figure 4.
Figure 4.
Power of nine statistics: FPCA (discretization approach)–based statistics, FPCA (Fourier expansion approach)–based statistic, multivariate PC–based statistic, WSS, VT, collapsing method, generalized T2 statistic, single marker χ2 test, and CMC method (the variants with frequencies ≤ 0.005 were collapsed) as a function of proportion of risk-increasing variants for testing association of 22 rare variants with the disease under the recessive disease model, assuming baseline penetrance of 0.01, 3000 cases, and 3000 controls.
Figure 5.
Figure 5.
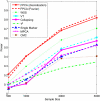
Power of nine statistics: FPCA (discretization approach)–based statistics, FPCA (Fourier expansion approach)–based statistic, multivariate PC–based statistic, WSS, VT, collapsing method, generalized T2 statistic, single marker χ2 test, and CMC method (the variants with frequencies ≤ 0.005 were collapsed) as a function of sample sizes for testing association of 22 rare variants, half of which were risk-increasing variants, with the disease under the additive disease model, assuming baseline penetrance of 0.01.
Figure 6.
Figure 6.
Power of nine statistics: FPCA (discretization approach)–based statistics, FPCA (Fourier expansion approach)–based statistic, multivariate PC–based statistic, WSS, VT, collapsing method, generalized T2 statistic, single marker χ2 test, and CMC method (the variants with frequencies ≤ 0.005 were collapsed) as a function of sample sizes for testing association of 22 rare variants, half of which were risk-increasing variants, with the disease under the dominant disease model, assuming baseline penetrance of 0.01.
Figure 7.
Figure 7.
Power of nine statistics: FPCA (discretization approach)–based statistics, FPCA (Fourier expansion approach)–based statistic, multivariate PC–based statistic, WSS, VT, collapsing method, generalized T2 statistic, single marker χ2 test, and CMC method (the variants with frequencies ≤ 0.005 were collapsed) as a function of sample sizes for testing association of 22 rare variants, half of which were risk-increasing variants, with the disease under the multiplicative disease model, assuming baseline penetrance of 0.01.
Figure 8.
Figure 8.
Power of nine statistics: FPCA (discretization approach)–based statistics, FPCA (Fourier expansion approach)–based statistic, multivariate PC–based statistic, WSS, VT, collapsing method, generalized T2 statistic, single marker χ2 test, and CMC method (the variants with frequencies ≤ 0.005 were collapsed) as a function of sample sizes for testing association of 22 rare variants, 70% of which were risk-increasing variants, with the disease under the recessive disease model, assuming baseline penetrance of 0.01.

References

    1. Bansal V, Harismendy O, Tewhey R, Murray SS, Schork NJ, Topol EJ, Frazer KA 2010a. Accurate detection and genotyping of SNPs utilizing population sequencing data. Genome Res 20: 537–545 - PMC - PubMed
    1. Bansal V, Libiger O, Torkamani A, Schork NJ 2010b. Statistical analysis strategies for association studies involving rare variants. Nat Rev Genet 11: 773–785 - PMC - PubMed
    1. Bickeboller H, Thompson EA 1996. The probability distribution of the amount of an individual's genome surviving to the following generation. Genetics 143: 1043–1049 - PMC - PubMed
    1. Chaisson MJ, Brinza D, Pevzner PA 2009. De novo fragment assembly with short mate-paired reads: Does the read length matter? Genome Res 19: 336–346 - PMC - PubMed
    1. Cohen JC, Pertsemlidis A, Fahmi S, Esmail S, Vega GL, Grundy SM, Hobbs HH 2006. Multiple rare variants in NPC1L1 associated with reduced sterol absorption and plasma low-density lipoprotein levels. Proc Natl Acad Sci 103: 1810–1815 - PMC - PubMed

Publication types