. 2011 May 21;56(10):3107-22.
doi: 10.1088/0031-9155/56/10/014. Epub 2011 Apr 27.

Measurement of lung airways in three dimensions using hyperpolarized helium-3 MRI

Affiliations

Measurement of lung airways in three dimensions using hyperpolarized helium-3 MRI

Eric T Peterson et al. Phys Med Biol. .

Abstract

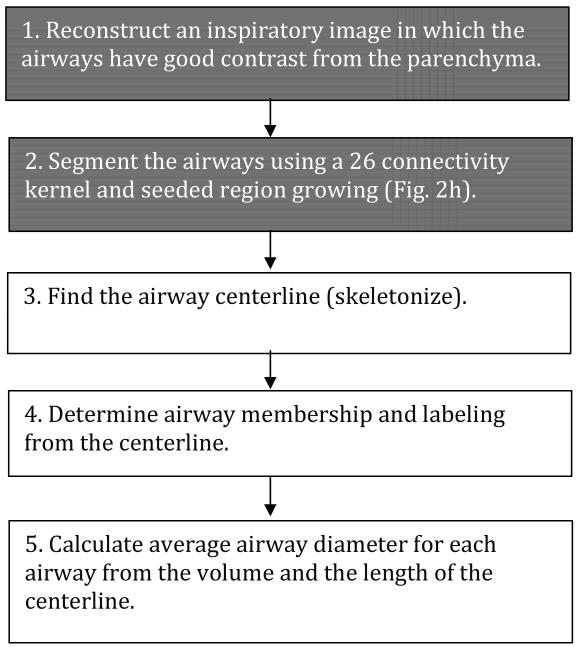
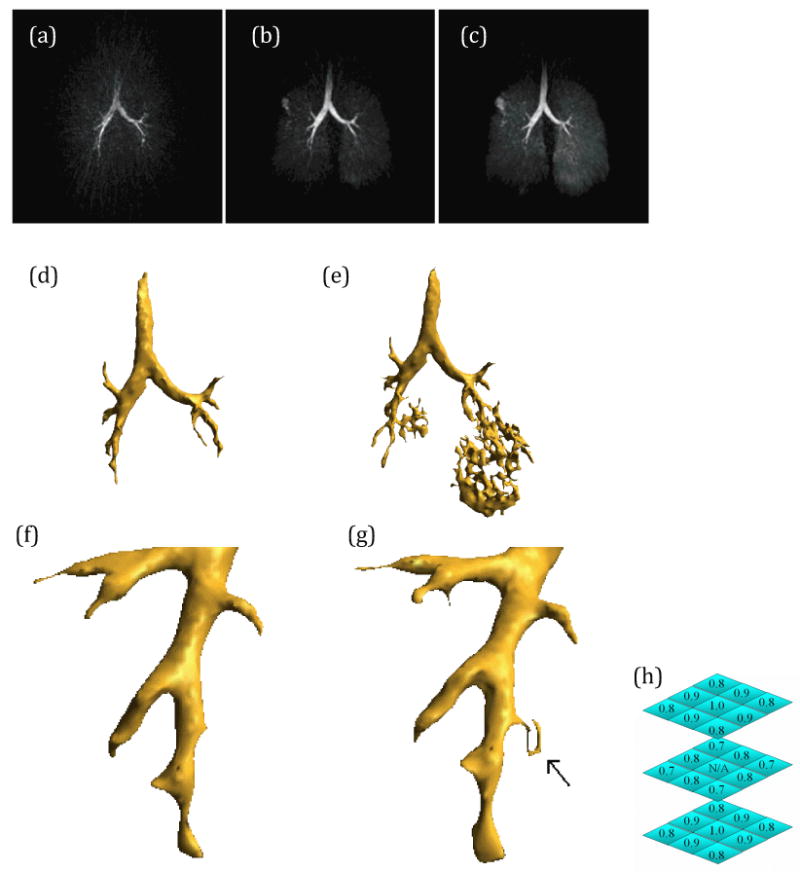
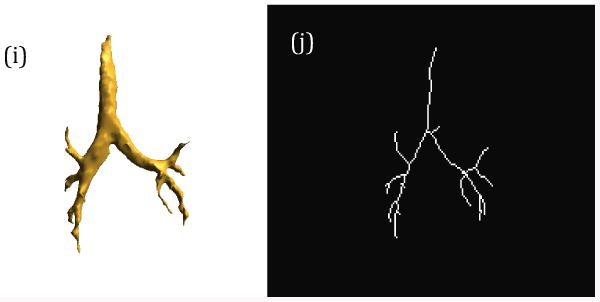
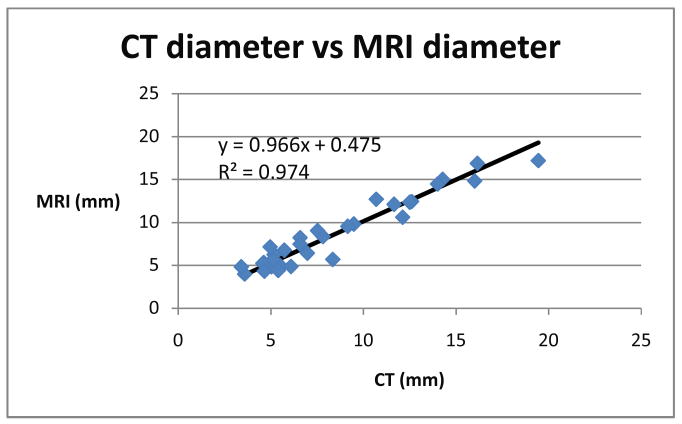
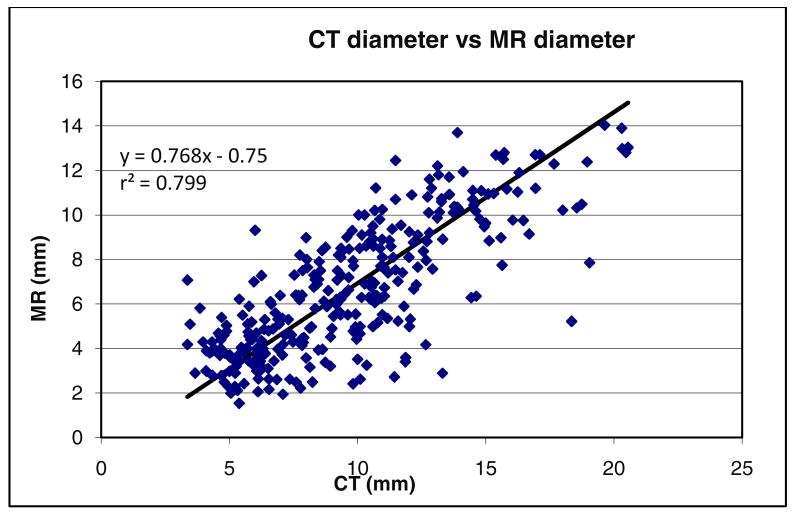
Large airway measurement is clinically important in cases of airway disease and trauma. The gold standard is computed tomography (CT), which allows for airway measurement. However, the ionizing radiation dose associated with CT is a major limitation in longitudinal studies and trauma. To avoid ionizing radiation from CT, we present a method for measuring the large airway diameter in humans using hyperpolarized helium-3 (HPHe) MRI in conjunction with a dynamic 3D radial acquisition. An algorithm is introduced which utilizes the significant airway contrast for semi-automated segmentation and skeletonization which is used to derive the airway lumen diameter. The HPHe MRI method was validated with quantitative CT in an excised and desiccated porcine lung (linear regression R(2) = 0.974 and slope = 0.966 over 32 airway segments). The airway lumen diameters were then compared in 24 human subjects (22 asthmatics and 2 normals; linear regression R(2) value of 0.799 and slope = 0.768 over 309 airway segments). The feasibility for airway path analysis to areas of ventilation defect is also demonstrated.


Figures

Figure 1
Figure 1
Flowchart for the image measurement algorithm. White boxes indicate fully automatic steps, gray boxes indicate semi automatic steps.
Figure 2
Figure 2
This figure shows the work flow of a typical airway measurement. Note that the images shown represent a subject with a pulmonary aneurysm in the right upper lobe. The time frame selection shows 3 frames, each spaced 3 seconds apart. The ideal time frame (b), reconstructing too early results in low SNR and poor airway filling (a), reconstructing too late results in lowered contrast between the airways and parenchyma (c). The signal normalization shows a correctly normalized segmentation (d), and an incorrectly normalized segmentation (e). Note that the voxel value correction enables similar segmentation quality in all regions of the image. The directionally constrained growth is shown with (f) and without (g) the directionality constraint enabled. In this example, the use of the constraint removes an erronous airway (arrow). A vertically oriented directional kernel is shown with typical image multiplier values (h). The rendered segmentation (i) and the skeletonization (j) of the final segmentation.
Figure 2
Figure 2
This figure shows the work flow of a typical airway measurement. Note that the images shown represent a subject with a pulmonary aneurysm in the right upper lobe. The time frame selection shows 3 frames, each spaced 3 seconds apart. The ideal time frame (b), reconstructing too early results in low SNR and poor airway filling (a), reconstructing too late results in lowered contrast between the airways and parenchyma (c). The signal normalization shows a correctly normalized segmentation (d), and an incorrectly normalized segmentation (e). Note that the voxel value correction enables similar segmentation quality in all regions of the image. The directionally constrained growth is shown with (f) and without (g) the directionality constraint enabled. In this example, the use of the constraint removes an erronous airway (arrow). A vertically oriented directional kernel is shown with typical image multiplier values (h). The rendered segmentation (i) and the skeletonization (j) of the final segmentation.
Figure 3
Figure 3
(a) Limited coronal MIP of the central airways of the desiccated procine lung on CT compared to (b) coronal MIP on HP He-3 MRI shows the major airways available for segmentation. Surface renderings of the segmented airways viewed in the coronal plane from CT (c) and MRI (d) show similar segmentation of the large airways within the spatial resolution limits of the MRI acquisition (3.3 mm). Cross-sectional views of the airways on (c) CT and (d) HP He-3 MRI indicated by arrows at the position of the LUL bronchus indicated are shown in (e) and (f).
Figure 4
Figure 4
Plot comparing the desiccated porcine lung diameters as measured by CT versus MRI. Both measurement modalities produce similar results when applied to the same fixed branching structure. The trend line is close to unity, which indicates that both measurement modalities produce similar results when a natural and fixed branching structure similar to human lungs is used.
Figure 5
Figure 5
Surface renderings of the airway tree for a normal subject derived from (a) CT and (b) He-3 MRI compared to a subject with clinically confirmed airway narrowing due to disease in the right upper lobe bronchus (arrows) depicted in (c) CT and (d) HP He-3 MRI.
Figure 6
Figure 6
a) Plot comparing CT versus MRI airway diameter data. Note that both the slope and the R2 values show good correlation between CT and MRI for a normal subject (a). CT versus MRI airway diameter data in the subject with right upper lobe airway obstruction due to a pulmonary aneurysm (b).
Figure 7
Figure 7
Plots of pathway analysis comparing the obstructed RUL path to normal LUL and predicted airway diameters using the Weibel model based on measured airway changes by generation for CT (a) and MR (b). Note that the path diameter to the RUL bends down drastically at the 2nd generation contrary to the Weibel model, whereas the path diameter to the LUL bends up slightly, predicted by the Weibel model.
Figure 8
Figure 8
Plot of CT vs. MRI lumen airway diameter measures in all human volunteers. Note that the slope less than 1 is likely due to smaller lung volume and lower lung pressure during the MRI when compared to CT.

Similar articles

Cited by

References

    1. Albert MS, Cates GD, Driehuys B, Happer W, Saam B, Springer CS, Jr, Wishnia A. Nature. Vol. 370. 1994. Biological magnetic resonance imaging using laser-polarized 129Xe; pp. 199–201. - PubMed
    1. Aysola RS, Hoffman EA, Gierada D, Wenzel S, Cook-Granroth J, Tarsi J, Zheng J, Schechtman KB, Ramkumar TP, Cochran R, Xueping E, Christie C, Newell J, Fain S, Altes TA, Castro M. Airway remodeling measured by multidetector CT is increased in severe asthma and correlates with pathology. Chest. 2008;134:1183–91. - PMC - PubMed
    1. Barger AV, Block WF, Toropov Y, Grist TM, Mistretta CA. Time-resolved contrast-enhanced imaging with isotropic resolution and broad coverage using an undersampled 3D projection trajectory. Magn Reson Med. 2002;48:297–305. - PubMed
    1. Brown RH, Mitzner W. Effect of lung inflation and airway muscle tone on airway diameter in vivo. J Appl Physiol. 1996;80:1581–8. - PubMed
    1. Brown RH, Mitzner W, Wagner E, Permutt S, Togias A. Airway distension with lung inflation measured by HRCT. Acad Radiol. 2003;10:1097–103. - PubMed

Publication types