

Traits and stress: keys to identify community effects of low levels of toxicants in test systems
- PMID: 21523409
- PMCID: PMC3134711
- DOI: 10.1007/s10646-011-0689-y
Traits and stress: keys to identify community effects of low levels of toxicants in test systems
Abstract
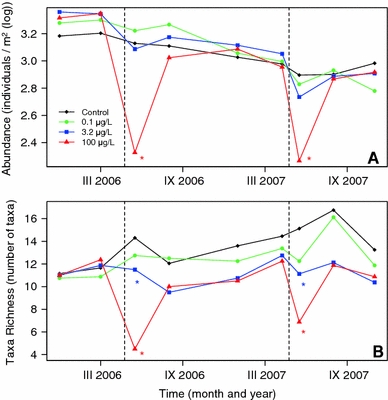
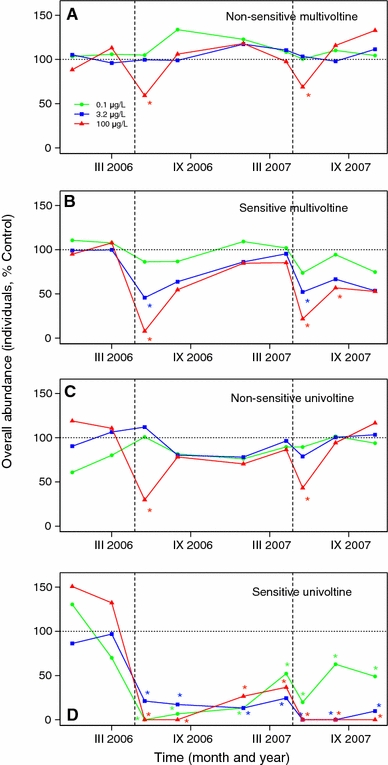
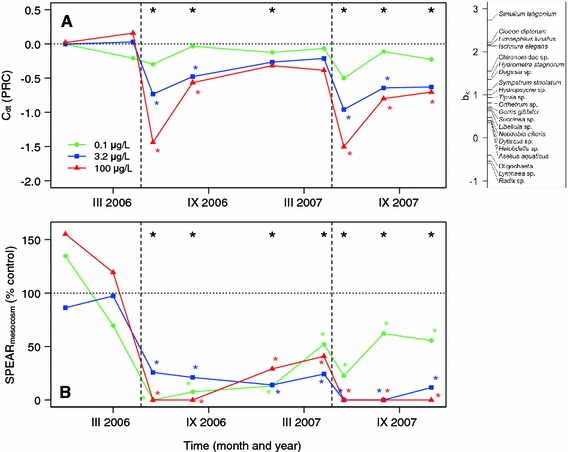
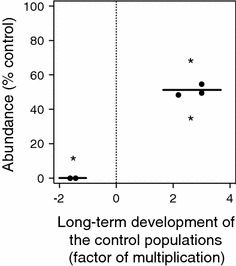
Community effects of low toxicant concentrations are obscured by a multitude of confounding factors. To resolve this issue for community test systems, we propose a trait-based approach to detect toxic effects. An experiment with outdoor stream mesocosms was established 2-years before contamination to allow the development of biotic interactions within the community. Following pulse contamination with the insecticide thiacloprid, communities were monitored for additional 2 years to observe long-term effects. Applying a priori ecotoxicological knowledge species were aggregated into trait-based groups that reflected stressor-specific vulnerability of populations to toxicant exposure. This reduces inter-replicate variation that is not related to toxicant effects and enables to better link exposure and effect. Species with low intrinsic sensitivity showed only transient effects at the highest thiacloprid concentration of 100 μg/l. Sensitive multivoltine species showed transient effects at 3.3 μg/l. Sensitive univoltine species were affected at 0.1 μg/l and did not recover during the year after contamination. Based on these results the new indicator SPEAR (mesocosm) was calculated as the relative abundance of sensitive univoltine taxa. Long-term community effects of thiacloprid were detected at concentrations 1,000 times below those detected by the PRC (Principal Response Curve) approach. We also found that those species, characterised by the most vulnerable trait combination, that were stressed were affected more strongly by thiacloprid than non-stressed species. We conclude that the grouping of species according to toxicant-related traits enables identification and prediction of community response to low levels of toxicants and that additionally the environmental context determines species sensitivity to toxicants.
Figures
Comment in
-
Response to "Traits and stress: keys to identify community effects of low levels of toxicants in test systems" by Liess and Beketov (2011).Ecotoxicology. 2012 Mar;21(2):297-9; discussion 300-3. doi: 10.1007/s10646-011-0825-8. Ecotoxicology. 2012. PMID: 22095161 Free PMC article. No abstract available.
References
-
- Baillieul M, Selens M, Blust R. Scope for growth and fitness of Daphnia magna in salinity-stressed conditions. Funct Ecol. 1996;10:227–233. doi: 10.2307/2389847. - DOI
Publication types
MeSH terms
Substances
LinkOut - more resources
Full Text Sources
