

Update in the methodology of the chronic stress paradigm: internal control matters
- PMID: 21524310
- PMCID: PMC3111355
- DOI: 10.1186/1744-9081-7-9
Update in the methodology of the chronic stress paradigm: internal control matters
Abstract
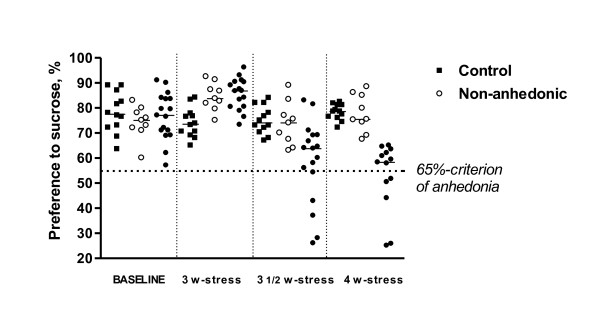
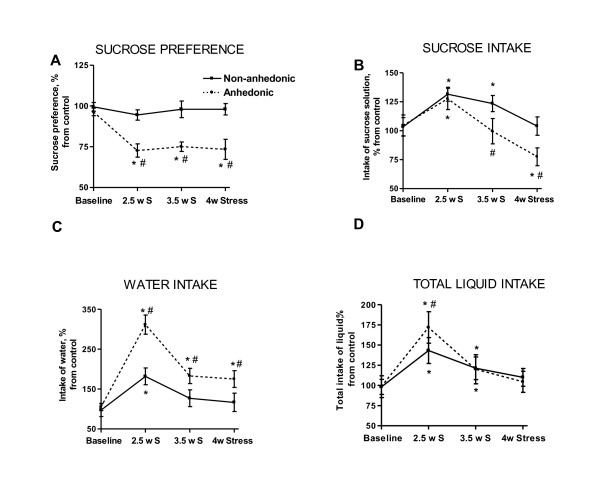
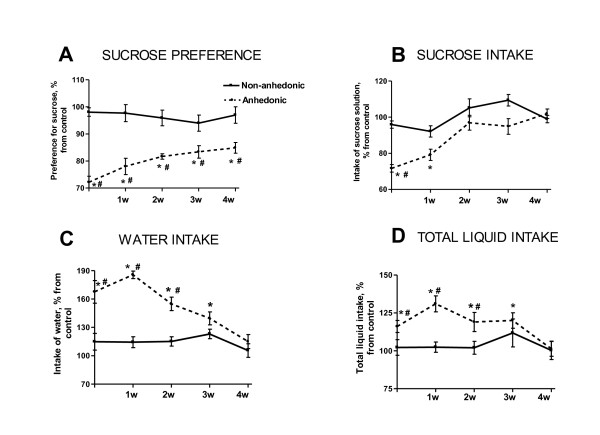
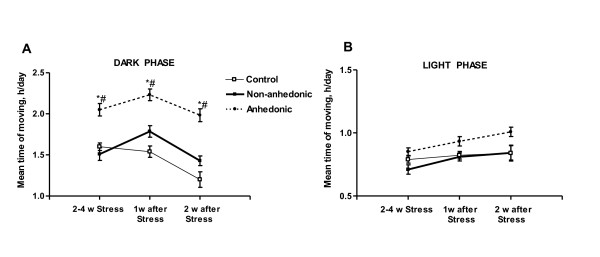
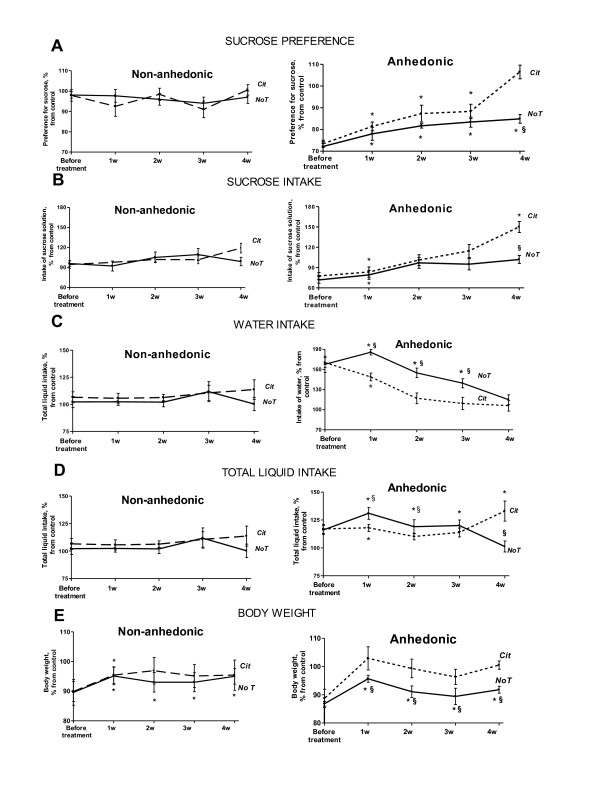
To date, the reliability of induction of a depressive-like state using chronic stress models is confronted by many methodological limitations. We believe that the modifications to the stress paradigm in mice proposed herein allow some of these limitations to be overcome. Here, we discuss a variant of the standard stress paradigm, which results in anhedonia. This anhedonic state was defined by a decrease in sucrose preference that was not exhibited by all animals. As such, we propose the use of non-anhedonic, stressed mice as an internal control in experimental mouse models of depression. The application of an internal control for the effects of stress, along with optimized behavioural testing, can enable the analysis of biological correlates of stress-induced anhedonia versus the consequences of stress alone in a chronic-stress depression model. This is illustrated, for instance, by distinct physiological and molecular profiles in anhedonic and non-anhedonic groups subjected to stress. These results argue for the use of a subgroup of individuals who are negative for the induction of a depressive phenotype during experimental paradigms of depression as an internal control, for more refined modeling of this disorder in animals.
Figures
Similar articles
-
Selective effects of citalopram in a mouse model of stress-induced anhedonia with a control for chronic stress.Behav Pharmacol. 2006 May;17(3):271-87. doi: 10.1097/00008877-200605000-00008. Behav Pharmacol. 2006. PMID: 16572005
-
Stress-induced anhedonia correlates with lower hippocampal serotonin transporter protein expression.Brain Res. 2013 Jun 4;1513:127-34. doi: 10.1016/j.brainres.2013.03.042. Epub 2013 Apr 1. Brain Res. 2013. PMID: 23558306
-
Measuring behavior in mice with chronic stress depression paradigm.Prog Neuropsychopharmacol Biol Psychiatry. 2010 Mar 17;34(2):348-61. doi: 10.1016/j.pnpbp.2009.12.014. Epub 2009 Dec 22. Prog Neuropsychopharmacol Biol Psychiatry. 2010. PMID: 20026369
-
Validity of chronic restraint stress for modeling anhedonic-like behavior in rodents: a systematic review and meta-analysis.J Int Med Res. 2022 Feb;50(2):3000605221075816. doi: 10.1177/03000605221075816. J Int Med Res. 2022. PMID: 35196899 Free PMC article.
-
Chronic unpredictable mild stress for modeling depression in rodents: Meta-analysis of model reliability.Neurosci Biobehav Rev. 2019 Apr;99:101-116. doi: 10.1016/j.neubiorev.2018.12.002. Epub 2018 Dec 6. Neurosci Biobehav Rev. 2019. PMID: 30529362 Review.
Cited by
-
Chronic mild stress induces anhedonic behavior and changes in glutamate release, BDNF trafficking and dendrite morphology only in stress vulnerable rats. The rapid restorative action of ketamine.Neurobiol Stress. 2019 Apr 2;10:100160. doi: 10.1016/j.ynstr.2019.100160. eCollection 2019 Feb. Neurobiol Stress. 2019. PMID: 31193464 Free PMC article.
-
Paternal preconception ethanol exposure blunts hypothalamic-pituitary-adrenal axis responsivity and stress-induced excessive fluid intake in male mice.Alcohol. 2016 Jun;53:19-25. doi: 10.1016/j.alcohol.2016.03.006. Epub 2016 Apr 22. Alcohol. 2016. PMID: 27286933 Free PMC article.
-
Reliability of sucrose preference testing following short or no food and water deprivation-a Systematic Review and Meta-Analysis of rat models of chronic unpredictable stress.Transl Psychiatry. 2024 Jan 19;14(1):39. doi: 10.1038/s41398-024-02742-0. Transl Psychiatry. 2024. PMID: 38242881 Free PMC article.
-
Peptide LCGA-17 Attenuates Behavioral and Neurochemical Deficits in Rodent Models of PTSD and Depression.Pharmaceuticals (Basel). 2022 Apr 12;15(4):462. doi: 10.3390/ph15040462. Pharmaceuticals (Basel). 2022. PMID: 35455459 Free PMC article.
-
Incoordination among Subcellular Compartments Is Associated with Depression-Like Behavior Induced by Chronic Mild Stress.Int J Neuropsychopharmacol. 2016 Apr 29;19(5):pyv122. doi: 10.1093/ijnp/pyv122. Print 2016 May. Int J Neuropsychopharmacol. 2016. PMID: 26506857 Free PMC article.
References
-
- Lexis M, Jansen N, van Amelsvoort L, van den Brandt P, Kant I. Depressive complaints as a predictor of sickness absence among the working population. J Occup Environ Med. 2009;5:887–895. - PubMed
Publication types
MeSH terms
Substances
LinkOut - more resources
Full Text Sources
Medical
Research Materials
