

Cyclization of the intrinsically disordered α1S dihydropyridine receptor II-III loop enhances secondary structure and in vitro function
- PMID: 21525002
- PMCID: PMC3121403
- DOI: 10.1074/jbc.M110.205476
Cyclization of the intrinsically disordered α1S dihydropyridine receptor II-III loop enhances secondary structure and in vitro function
Abstract
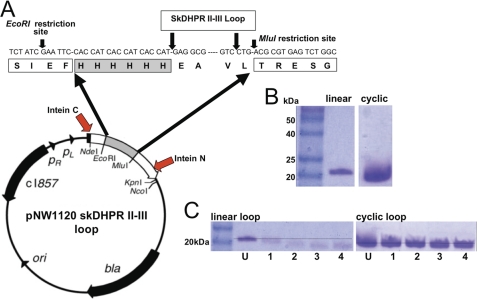
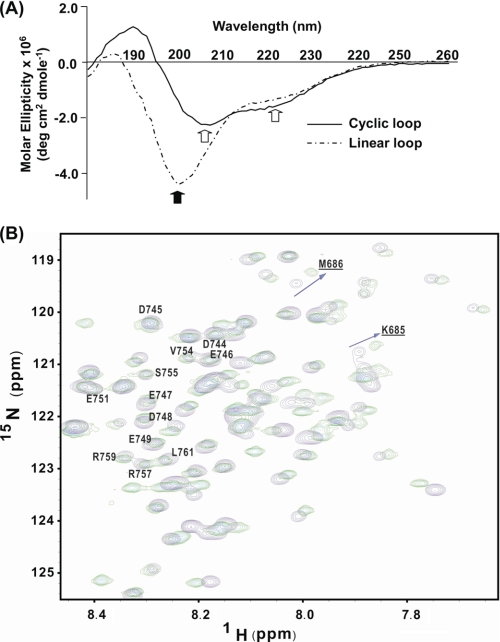
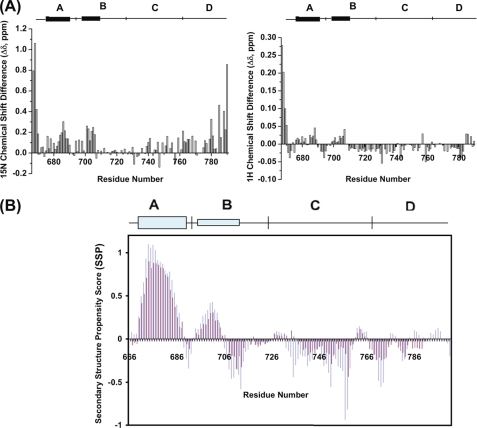
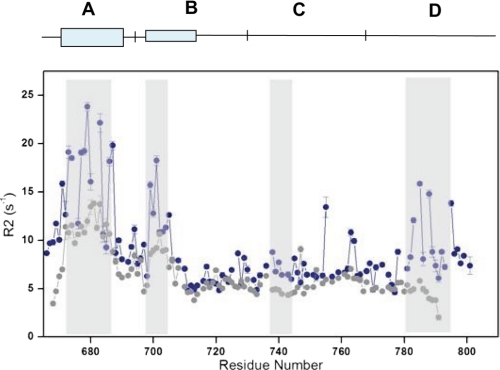
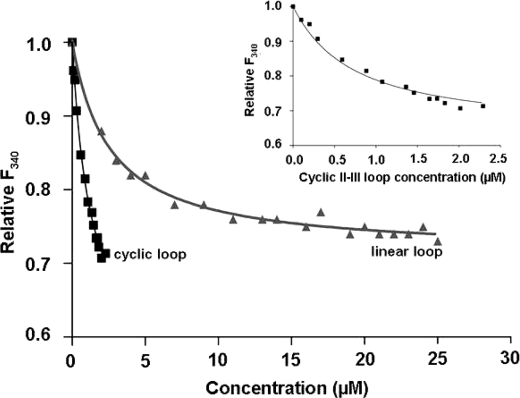
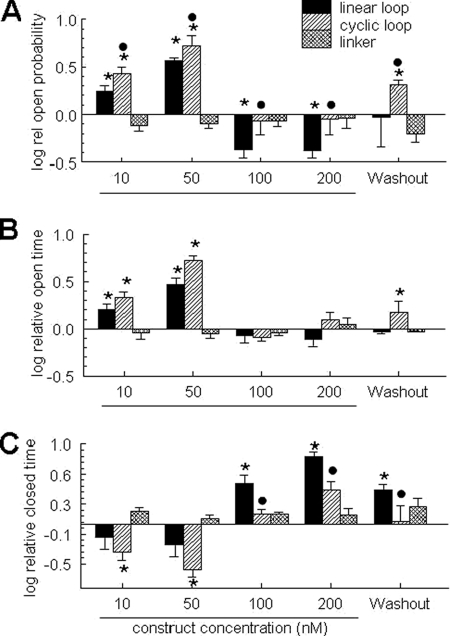
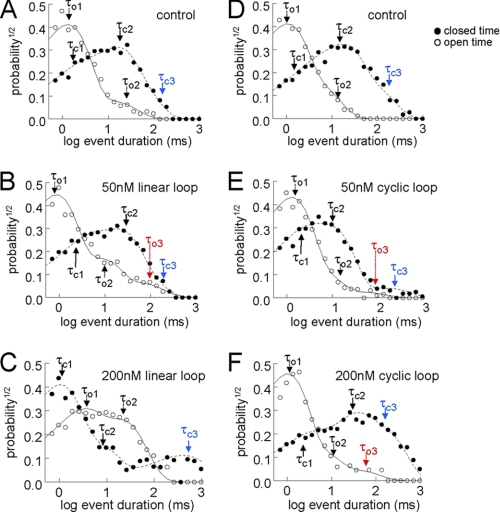
A key component of excitation contraction (EC) coupling in skeletal muscle is the cytoplasmic linker (II-III loop) between the second and third transmembrane repeats of the α(1S) subunit of the dihydropyridine receptor (DHPR). The II-III loop has been previously examined in vitro using a linear II-III loop with unrestrained N- and C-terminal ends. To better reproduce the loop structure in its native environment (tethered to the DHPR transmembrane domains), we have joined the N and C termini using intein-mediated technology. Circular dichroism and NMR spectroscopy revealed a structural shift in the cyclized loop toward a protein with increased α-helical and β-strand structure in a region of the loop implicated in its in vitro function and also in a critical region for EC coupling. The affinity of binding of the II-III loop binding to the SPRY2 domain of the skeletal ryanodine receptor (RyR1) increased 4-fold, and its ability to activate RyR1 channels in lipid bilayers was enhanced 3-fold by cyclization. These functional changes were predicted consequences of the structural enhancement. We suggest that tethering the N and C termini stabilized secondary structural elements in the DHPR II-III loop and may reflect structural and dynamic characteristics of the loop that are inherent in EC coupling.
Figures


Similar articles
-
A dihydropyridine receptor alpha1s loop region critical for skeletal muscle contraction is intrinsically unstructured and binds to a SPRY domain of the type 1 ryanodine receptor.Int J Biochem Cell Biol. 2009 Mar;41(3):677-86. doi: 10.1016/j.biocel.2008.08.004. Epub 2008 Aug 8. Int J Biochem Cell Biol. 2009. PMID: 18761102
-
Structural requirements of the dihydropyridine receptor alpha1S II-III loop for skeletal-type excitation-contraction coupling.J Biol Chem. 2004 Feb 6;279(6):4721-8. doi: 10.1074/jbc.M307538200. Epub 2003 Nov 18. J Biol Chem. 2004. PMID: 14627713
-
Fluorescence Resonance Energy Transfer-based Structural Analysis of the Dihydropyridine Receptor α1S Subunit Reveals Conformational Differences Induced by Binding of the β1a Subunit.J Biol Chem. 2016 Jun 24;291(26):13762-70. doi: 10.1074/jbc.M115.704049. Epub 2016 Apr 25. J Biol Chem. 2016. PMID: 27129199 Free PMC article.
-
Molecular recognition of the disordered dihydropyridine receptor II-III loop by a conserved spry domain of the type 1 ryanodine receptor.Clin Exp Pharmacol Physiol. 2009 Mar;36(3):346-9. doi: 10.1111/j.1440-1681.2008.05130.x. Epub 2008 Nov 28. Clin Exp Pharmacol Physiol. 2009. PMID: 19076161 Review.
-
Functional equivalence of dihydropyridine receptor alpha1S and beta1a subunits in triggering excitation-contraction coupling in skeletal muscle.Biol Res. 2004;37(4):565-75. doi: 10.4067/s0716-97602004000400010. Biol Res. 2004. PMID: 15709683 Review.
Cited by
-
A new cytoplasmic interaction between junctin and ryanodine receptor Ca2+ release channels.J Cell Sci. 2015 Mar 1;128(5):951-63. doi: 10.1242/jcs.160689. Epub 2015 Jan 20. J Cell Sci. 2015. PMID: 25609705 Free PMC article.
-
Ryanodine receptors: structure and function.J Biol Chem. 2012 Sep 14;287(38):31624-32. doi: 10.1074/jbc.R112.349068. Epub 2012 Jul 20. J Biol Chem. 2012. PMID: 22822064 Free PMC article. Review.
-
Regions of ryanodine receptors that influence activation by the dihydropyridine receptor β1a subunit.Skelet Muscle. 2015 Jul 22;5:23. doi: 10.1186/s13395-015-0049-3. eCollection 2015. Skelet Muscle. 2015. PMID: 26203350 Free PMC article.
-
An X-linked channelopathy with cardiomegaly due to a CLIC2 mutation enhancing ryanodine receptor channel activity.Hum Mol Genet. 2012 Oct 15;21(20):4497-507. doi: 10.1093/hmg/dds292. Epub 2012 Jul 19. Hum Mol Genet. 2012. PMID: 22814392 Free PMC article.
-
Three-dimensional localization of the α and β subunits and of the II-III loop in the skeletal muscle L-type Ca2+ channel.J Biol Chem. 2012 Dec 21;287(52):43853-61. doi: 10.1074/jbc.M112.419283. Epub 2012 Nov 1. J Biol Chem. 2012. PMID: 23118233 Free PMC article.
References
-
- Dulhunty A. F., Haarmann C. S., Green D., Laver D. R., Board P. G., Casarotto M. G. (2002) Prog. Biophys. Mol. Biol. 79, 45–75 - PubMed
-
- Kugler G., Weiss R. G., Flucher B. E., Grabner M. (2004) J. Biol. Chem. 279, 4721–4728 - PubMed
-
- Tanabe T., Beam K. G., Adams B. A., Niidome T., Numa S. (1990) Nature 346, 567–569 - PubMed
Publication types
MeSH terms
Substances
LinkOut - more resources
Full Text Sources
Molecular Biology Databases
