. 2012 Jan;13(1):107-21.
doi: 10.1093/bib/bbr009. Epub 2011 Apr 27.

A large-scale benchmark study of existing algorithms for taxonomy-independent microbial community analysis

Affiliations

A large-scale benchmark study of existing algorithms for taxonomy-independent microbial community analysis

Yijun Sun et al. Brief Bioinform. 2012 Jan.

Abstract

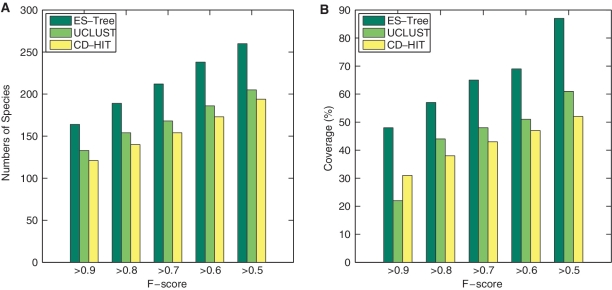
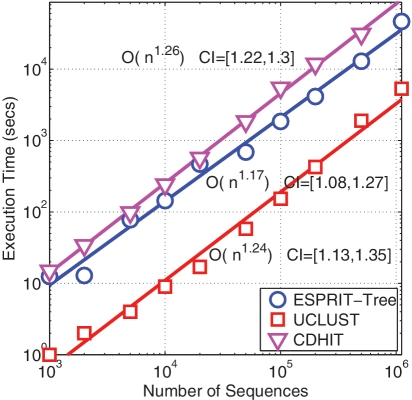
Recent advances in massively parallel sequencing technology have created new opportunities to probe the hidden world of microbes. Taxonomy-independent clustering of the 16S rRNA gene is usually the first step in analyzing microbial communities. Dozens of algorithms have been developed in the last decade, but a comprehensive benchmark study is lacking. Here, we survey algorithms currently used by microbiologists, and compare seven representative methods in a large-scale benchmark study that addresses several issues of concern. A new experimental protocol was developed that allows different algorithms to be compared using the same platform, and several criteria were introduced to facilitate a quantitative evaluation of the clustering performance of each algorithm. We found that existing methods vary widely in their outputs, and that inappropriate use of distance levels for taxonomic assignments likely resulted in substantial overestimates of biodiversity in many studies. The benchmark study identified our recently developed ESPRIT-Tree, a fast implementation of the average linkage-based hierarchical clustering algorithm, as one of the best algorithms available in terms of computational efficiency and clustering accuracy.


Figures

Figure 1:
Figure 1:
(A) Sequence pairs with distances less than 0.10 only account for a small fraction of all possible pairs (2.25% in this example). (B) Pairwise distances between the same pair of sequences computed based on multiple sequence alignments containing different sequences in the rest of the alignment are much larger than the constant value of 0.06 computed by using pairwise sequence alignment, and vary over a wide range, from 0.06 to 0.22 (i.e. sequences that are really 6% different can appear 22% different due to the MSA procedure). The experiment was performed on the 53R seawater sample downloaded from [19].
Figure 2:
Figure 2:
A toy example that illustrates the algorithmic behaviors of the HC and greedy heuristic clustering methods. (A) The data set was generated from two distinct Gaussian distributions; (B) HC successfully recovered the true clustering structure; (C) greedy heuristic clustering performed poorly, and the result depended on selected seeds. At the same dissimilarity level, the two approaches behave differently.
Figure 3:
Figure 3:
A toy example illustrates that distance levels required to merge the same pair of clusters are different for AL, CL and greedy heuristic clustering. Each node represents a sequence.
Figure 4:
Figure 4:
The species abundance distribution represented by one of the test data sets. The simulated data contains high, medium and low abundance components, which is similar to those observed in a real microbial community and much more complicated than our previously used mock community generated from 43 known 16 S rRNA sequences.
Figure 5:
Figure 5:
(A) NMI scores of six methods evaluated at ten distance levels. (B) Boxplots of the maximum NMI scores of six methods. Species assignments of input sequences were used as the ground truth. MUSCLE+AL performed much worse than all other methods, and its results are omitted so that the remainder can usefully be compared on the same scale.
Figure 6:
Figure 6:
NMI scores of mothur evaluated on a V2 annotated data set dropped significantly when the top 1000 best-matched reference sequences of query sequences were removed from the SILVA database.
Figure 7:
Figure 7:
(A) NMI scores of six methods evaluated at 10 distance levels. (B) Boxplots of the maximum NMI scores of six methods. Genus assignments of input sequences were used as the ground truth.
Figure 8:
Figure 8:
The NMI scores of ESPRIT-Tree applied to simulated reads extracted from various hypervariable regions including V2, V4, V6, V3–5, V6–9 and near full-length 16 S rRNA gene. The species assignments were used as ground truth. The scores peak at different distance levels. The circles indicate the distance levels where the estimated numbers of OTUs equal to the numbers of species in the test data sets. Colour version of this figure available at http://bib.oxfordjournals.org.
Figure 9:
Figure 9:
The numbers of species identified by ESPRIT-Tree, CD-HIT and UCLUST that have F-scores exceeding 0.9, 0.8, 0.7, 0.6 and 0.5, respectively. The corresponding coverage is also reported. ESPRIT-Tree recovered 260 species with F-score >0.5 covering 87% of the total sequences, which is significantly better than CD-HIT and UCLUST. Colour version of this figure available at http://bib.oxfordjournals.org.
Figure 10:
Figure 10:
CPU times of ESPRIT-Tree, UCLUST and CD-HIT performed on gut data sets with a varying number of sequences (1000–1 100 000). The empirical complexity and confidence interval (CI) are also reported. ESPRIT-Tree, UCLUST and CD-HIT have a quasilinear computational complexity of O(N1.2).

References

    1. Eisen JA. Environmental shotgun sequencing: its potential and challenges for studying the hidden world of microbes. PLoS Biol. 2007;5:e82. - PMC - PubMed
    1. Rothberg J, Leamon J. The development and impact of 454 sequencing. Nat Biotechnol. 2008;26:1117–24. - PubMed
    1. Peterson J, Garges S, Giovanni M, et al. The NIH Human Microbiome Project. Genome Res. 2009;19:2317–23. - PMC - PubMed
    1. Altschul SF, Gish W, Miller W, et al. Basic local alignment search tool. J Mol Biol. 1990;215:403–10. - PubMed
    1. Cole JR, Wang Q, Cardenas E, et al. The Ribosomal Database Project: improved alignments and new tools for rRNA analysis. Nucleic Acids Res. 2009;37:D141–5. - PMC - PubMed

Publication types

Substances