. 2011 Jul;85(13):6657-68.
doi: 10.1128/JVI.00302-11. Epub 2011 Apr 27.

Ambivalent role of the innate immune response in rabies virus pathogenesis

Affiliations

Ambivalent role of the innate immune response in rabies virus pathogenesis

Damien Chopy et al. J Virol. 2011 Jul.

Abstract

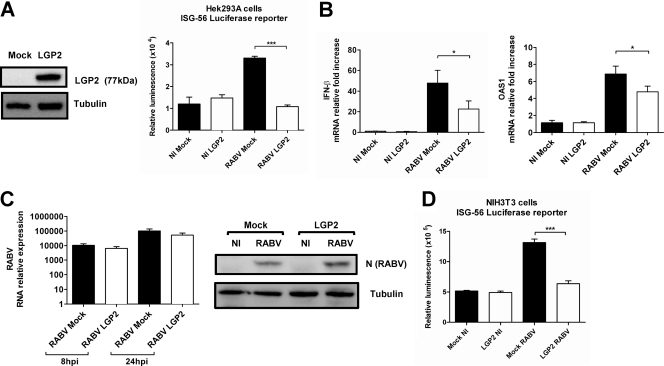
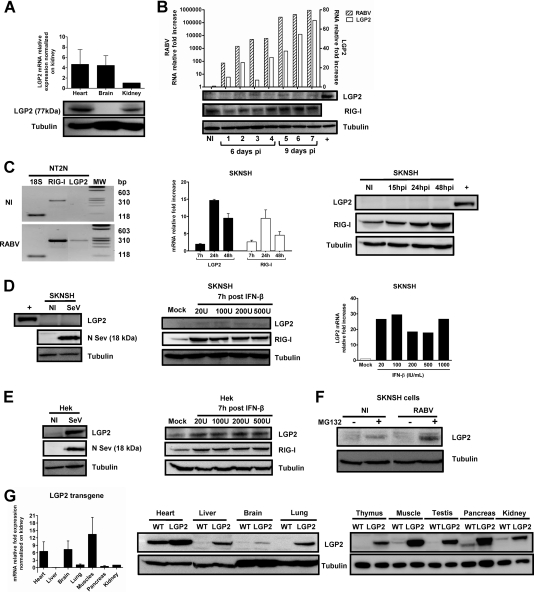
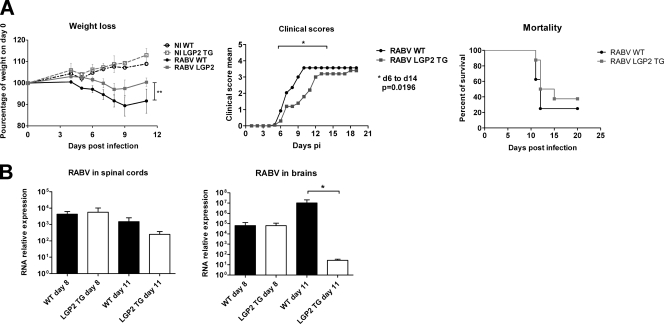
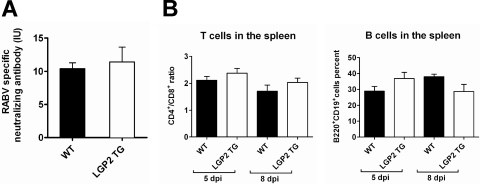
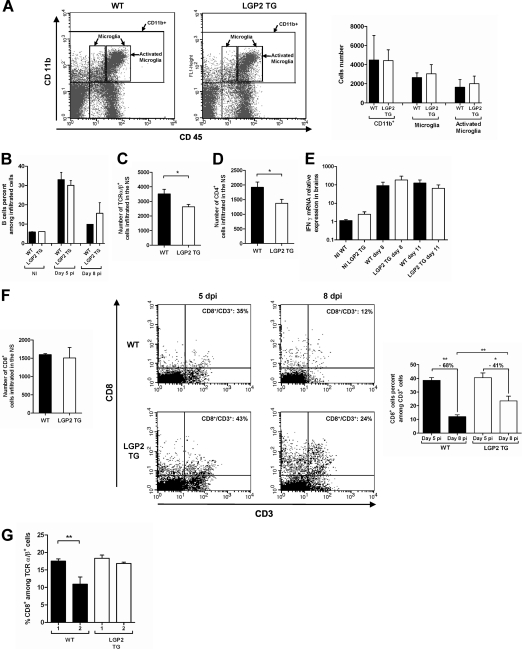
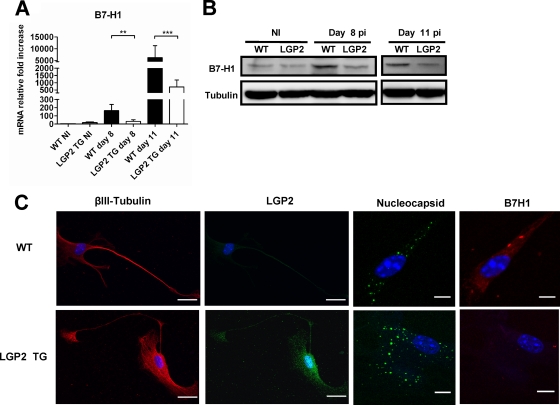
The neurotropic rabies virus (RABV) has developed several evasive strategies, including immunoevasion, to successfully infect the nervous system (NS) and trigger a fatal encephalomyelitis. Here we show that expression of LGP2, a protein known as either a positive or negative regulator of the RIG-I-mediated innate immune response, is restricted in the NS. We used a new transgenic mouse model (LGP2 TG) overexpressing LGP2 to impair the innate immune response to RABV and thus revealed the role of the RIG-I-mediated innate immune response in RABV pathogenesis. After infection, LGP2 TG mice exhibited reduced expression of inflammatory/chemoattractive molecules, beta interferon (IFN-β), and IFN-stimulated genes in their NS compared to wild-type (WT) mice, demonstrating the inhibitory function of LGP2 in the innate immune response to RABV. Surprisingly, LGP2 TG mice showed more viral clearance in the brain and lower morbidity than WT mice, indicating that the host innate immune response, paradoxically, favors RABV neuroinvasiveness and morbidity. LGP2 TG mice exhibited similar neutralizing antibodies and microglia activation to those of WT mice but showed a reduction of infiltrating CD4(+) T cells and less disappearance of infiltrating CD8(+) T cells. This occurred concomitantly with reduced neural expression of the IFN-inducible protein B7-H1, an immunoevasive protein involved in the elimination of infiltrated CD8(+) T cells. Our study shows that the host innate immune response favors the infiltration of T cells and, at the same time, promotes CD8(+) T cell elimination. Thus, to a certain extent, RABV exploits the innate immune response to develop its immunoevasive strategy.


Figures

Fig. 1.
Fig. 1.
LGP2 inhibits the type I IFN response during RABV infection in vitro. (A) Hek cells were cotransfected with a plasmid encoding a luciferase reporter under the control of an ISG56 promoter, a β-galactosidase-encoding plasmid (used as a transfection efficiency control), and an empty vector (mock) or LGP2-encoding vector (LGP2). LGP2 protein overexpression was checked by Western blotting, with tubulin used as the internal control. After 24 h, luciferase activity was measured by detecting the luminescence in RABV-infected cells (n = 4). Data are presented as means and standard errors of the means (SEM) (***, P ≤ 0.0005). (B) Hek cells transfected with LGP2-encoding vector (LGP2) or an empty vector (mock) were infected with RABV. RNAs were extracted at 24 h p.i., and qRT-PCR targeting IFN-β and OAS1 was performed (n = 6). Data are presented as means and SEM (*, P ≤ 0.05). (C) After 24 h, RABV infection was monitored in LGP2- and empty vector (mock)-transfected cells by qRT-PCR (left) and by Western blotting against the RABV N protein (right). Data are representative of two independent experiments. qRT-PCR results are presented as means and SEM. (D) NIH 3T3 cells were cotransfected as described for panel A. After 24 h, luciferase activity was measured by detecting the luminescence in noninfected (NI) and RABV-infected cells (n = 4). Data are presented as means and SEM (***, P ≤ 0.0005).
Fig. 2.
Fig. 2.
LGP2 protein expression is strongly restricted in mouse brain and human neuronal cells because of its degradation. (A) LGP2 mRNA (top) and LGP2 protein (bottom) expression in the hearts, brains, and kidneys of WT mice was quantified by qRT-PCR and normalized to the LGP2 mRNA level in the kidney (value taken as 1) or determined by Western blotting normalized to tubulin. qRT-PCR data are presented as means and SEM (n = 4). (B) Seven RABV-infected mice were sacrificed at different times after virus injection (the first 4 mice were sacrificed at day 6 p.i., and the last 4 were sacrificed at day 9 p.i.). Brains were separated into two parts. One half of the brain was used for qRT-PCR, and the other was used for Western blotting. RABV N and endogenous mouse LGP2 mRNAs in the brains of RABV-infected WT mice or noninfected (NI) animals were quantified by qRT-PCR (top). LGP2, RIG-I (used as a control protein), and tubulin (used as a gel loading control) protein expression in the brains of sacrificed mice was monitored using Western blotting (bottom panels). The positive control (+) is LGP2 expression in a WT heart lysate. (C) LGP2 and RIG-I expression in human postmitotic neurons (NT2N) and neuroblastoma SKNSH cells after RABV infection (24 h for NT2N cells and 7, 15, 24, and 48 h for SKNSH cells) or no infection (NI) was measured by RT-PCR (NT2N cells; 18S rRNA was used as an internal control) and by qRT-PCR (SKNSH cells; values were normalized to the NI control, with a value of 1). Proteins were detected by Western blotting for SKNSH cells, with a heart lysate as a positive control (+) for LGP2 protein (n = 3). (D) LGP2 expression in SKNSH cells was measured 24 h after SeV infection by Western blotting (left; SeV N protein expression was used as a control for infection) and 7 h after treatment with increasing doses of IFN-β (20, 100, 200, and 500 IU/ml) by Western blotting (central panel; RIG-I expression was used as a control for IFN-β treatment efficiency) and qRT-PCR (normalized with the mock value, taken as 1). (E) LGP2 expression in nonneuronal cells (Hek) was measured by Western blotting 24 h after SeV infection (left) and 7 h after treatment with increasing IFN-β doses (right). SeV N protein expression was used as a control for infection, RIG-I was used as a control for IFN-β treatment efficacy, and tubulin was used as a control for protein loading. (F) Western blotting showing the effect of MG132 treatment (10 μM) on LGP2 expression in NI and RABV-infected SKNSH cells. (G) LGP2 expression in the brains of LGP2 TG mice. LGP2 protein and LGP2 mRNA expression was analyzed by qRT-PCR normalized to LGP2 transgenic mRNA levels in the kidney (n = 4) (left) (data are presented as means and SEM) and by Western blotting with lysates of hearts, livers, brains, lungs, thymuses, muscles, testes, pancreases, and kidneys of LGP2 TG (LGP2) and WT mice (right). Tubulin was used as a control of protein loading.
Fig. 3.
Fig. 3.
LGP2 overexpression in LGP2 TG mice does not modify basal gliosis and monocyte influx into the brain. (A) Astrogliosis was assayed by immunohistochemistry on noninfected WT and LGP2 TG paraffin-embedded brain sections, using a GFAP primary Ab. Numbers of GFAP+ cells in the caudal diencephalon were 44.6 ± 4.2 and 51.3 ± 3.1 for WT and LGP2 TG mice, respectively (20 fields were counted per mouse type). (B) Flow cytometry of cells isolated from the NS of WT and LGP2 TG mice by use of a Percoll gradient and double stained with CD11b and CD45 Abs to analyze monocyte infiltration and microglia activation. The CD11b+ cells correspond to infiltrated monocytes (9.7 and 7.5% in WT and LGP2 TG mice, respectively), and the CD11b+ CD45+ intermediate cells are microglia (1% in both types of mice). Results are representative of two independent experiments.
Fig. 4.
Fig. 4.
LGP2 inhibits RABV-triggered type 1 IFN and inflammatory responses in the infected NS. (A) IFN-β, OAS1, and IL-6 transcripts in the spinal cords (upper row) and brains (lower row) of WT and LGP2 TG mice sacrificed on day 8 and day 11 p.i. (n = 7 or 8) were quantified by qRT-PCR and normalized to values obtained for mock-infected tissues (value set to 1). Data are presented as means and SEM (*, P ≤ 0.05; **, P ≤ 0.005; ***, P ≤ 0.0005). (B) Inflammatory bioarray analysis of markers of IFN-mediated and inflammatory responses (IL-12p40p70, CXCL9, TIMP-1, sTNF-R1, CCL5, IL-13, CXCL11, CCL2, and IL-6) in NI and RABV-infected brains of WT and LGP2 TG mice at days 8 and 11 p.i. (n = 2) (normalized value = 100 for NI WT mouse brain). The results are representative of two independent experiments.
Fig. 5.
Fig. 5.
Forced expression of LGP2 slows down RABV clinical progression and favors RABV clearance from the brain. WT and LGP2 TG mice (n = 8) were injected intramuscularly with a dose of an encephalitic strain of RABV sufficient to kill 80% of injected mice. (A) Clinical signs of rabies (body weight loss, cumulative clinical scores) and mortality curves were followed in WT (black) and LGP2 TG (gray) mice. Results are representative of at least three independent experiments. (B) RABV neuroinvasiveness in the spinal cords and brains of WT and LGP2 TG mice was compared by qRT-PCR targeting the RABV N protein at 8 and 11 days p.i. (n = 7 or 8). Data are presented as means and SEM (*, P ≤ 0.05).
Fig. 6.
Fig. 6.
Innate immune impairment does not modify immune parameters in the periphery. (A) RABV-specific neutralizing Ab titers (expressed in international units per ml [IU/ml]) in the blood were compared by the rapid fluorescent-focus inhibition technique, using WT and LGP2 TG mouse sera taken at 11 days p.i. (n = 9 and 8, respectively). (B) LGP2 TG and WT mice exhibited similar spleen subpopulations. Spleen cells of RABV-infected WT and LGP2 TG mice (n = 4) were taken at days 5 and 8 p.i. and stained with paired Abs for CD4 and CD8 or B220 and CD19. Percentages of CD4+ CD8+ and CD19+ B220+ cell populations were analyzed by flow cytometry. Results are presented as CD4+/CD8+ ratios and percentages of B220+ CD19+ cells (n = 8).
Fig. 7.
Fig. 7.
Innate immune impairment does not modify activation of microglia or IFN-γ mRNA expression but inhibits T cell infiltration and prevents CD8+ T cell destruction in RABV-infected brains. (A) Microglia activation was analyzed by flow cytometry with cells isolated from the NS of day 6 RABV-infected WT and LGP2 TG mice by use of a Percoll gradient and double stained with CD11b and CD45 Abs. Results are representative of two independent experiments. The numbers of monocytes (CD11b+ cells), microglia cells/macrophages (CD11b+ CD45+ [intermediate and high]), and activated microglia cells/macrophages (CD11b+ high CD45+) in the infiltrates of 6 day RABV-infected WT and LGP2 TG mice (n = 6) were compared. (B) Kinetics of infiltrated B cells (B220+ CD19+) in NI and day 5 and day 8 RABV-infected WT and LGP2 TG mice (n = 6) were compared. (C) T cell (TCRα/β+) infiltration of the NS in the two types of mice was compared at 6 days p.i. (n = 6). Data are presented as means for total infiltrated cells, with SEM. *, P < 0.05. (D) CD4+ T cell infiltration into the day 6 infected NS of WT and LGP2 TG mice was compared. *, P < 0.05. (E) IFN-γ transcripts in the brains of WT and LGP2 TG mice sacrificed at day 8 and day 11 p.i. (n = 7 or 8) were quantified by qRT-PCR and normalized to values obtained for NI tissues (set to 1). Data are presented as means and SEM. (F) Comparison of CD8+ T cell infiltration in the NS of RABV-infected WT and LGP2 TG mice. (Left) CD8+ T cell infiltration in the infected NS of WT and LGP2 TG mice was compared at 6 days p.i. (Middle) Flow cytometry diagrams of CD8 and CD3 double-stained cells isolated from the NS of WT and LGP2 TG mice at 5 and 8 days p.i. Numbers in the top right quadrants correspond to the percentage of CD8+ T cells among CD3+ T cells (CD8+/CD3+). (Right) Drops in CD8+ T cells between day 5 and day 8 in WT and LGP2 TG mice (n = 6) were compared. *, P < 0.05; **, P < 0.005. (G) Flow cytometry analysis of cells isolated from the NS of WT and LGP2 TG mice and double stained with CD8 and TCRα/β or CD8 and CD3 Abs. Percentages of CD8+ T cells among TCRα/β+ T cells in the NS of two groups each (1 and 2) of WT and LGP2 TG mice were compared at day 6 p.i. Groups 1 and 2 were determined according to the severity of clinical signs, as follows: group 1, weight loss of <5% of initial body weight, with mild clinical signs; and group 2, weight loss of >5% of initial body weight, with severe clinical signs (n = 4 in each group). Data are presented as mean percentages of CD8+ T cells among TCRα/β+ T cells, with SEM. **, P ≤ 0.005.
Fig. 8.
Fig. 8.
LGP2 inhibits RABV-induced B7-H1 expression in both NS and dorsal root ganglion neurons. B7-H1 expression in WT and LGP2 TG brains was measured by qRT-PCR (n = 7 or 8) (A) or by Western blotting (B) in the absence of infection (NI) or at 8 and 11 days p.i. Data are presented as means and SEM (**, P ≤ 0.005; ***, P ≤ 0.0005). (C) Primary neurons from dorsal root ganglia of adult WT (upper row) and LGP2 TG (lower row) mice were infected with RABV. Neurons were immunostained with paired Abs directed against βIII-tubulin (a marker for neurons), LGP2, RABV nucleocapsid, or B7-H1. The percentages of infected cells were similar (58.5% and 62.0% of RABV-infected cells) for WT and LGP2 TG cultures. Bar, 10 μm.

References

    1. Baloul L., Camelo S., Lafon M. 2004. Up-regulation of Fas ligand (FasL) in the central nervous system: a mechanism of immune evasion by rabies virus. J. Neurovirol. 10:372–382 - PubMed
    1. Bamming D., Horvath C. M. 2009. Regulation of signal transduction by enzymatically inactive antiviral RNA helicase proteins MDA5, RIG-I, and LGP2. J. Biol. Chem. 284:9700–9712 - PMC - PubMed
    1. Blondel D., et al. 2002. Rabies virus P and small P products interact directly with PML and reorganize PML nuclear bodies. Oncogene 21:7957–7970 - PubMed
    1. Brehin A.-C., et al. 2008. Dynamics of immune cell recruitment during West Nile encephalitis and identification of a new CD19+ B220− BST-2+ leukocyte population. J. Immunol. 180:6760–6767 - PubMed
    1. Breiman A., et al. 2005. Inhibition of RIG-I-dependent signaling to the interferon pathway during hepatitis C virus expression and restoration of signaling by IKKepsilon. J. Virol. 79:3969–3978 - PMC - PubMed

Publication types

MeSH terms