. 2011 Jun 1;186(11):6329-37.
doi: 10.4049/jimmunol.1100061. Epub 2011 Apr 27.

IL-2 controls the stability of Foxp3 expression in TGF-beta-induced Foxp3+ T cells in vivo

Affiliations

IL-2 controls the stability of Foxp3 expression in TGF-beta-induced Foxp3+ T cells in vivo

Qian Chen et al. J Immunol. .

Abstract

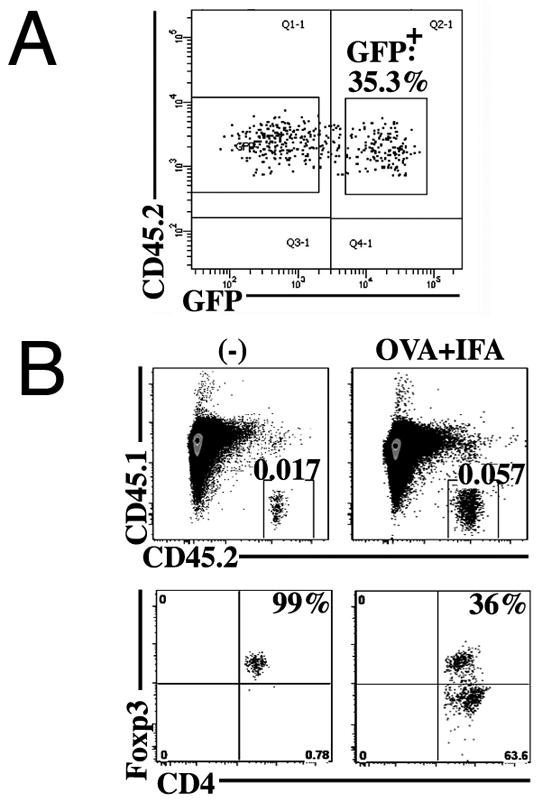
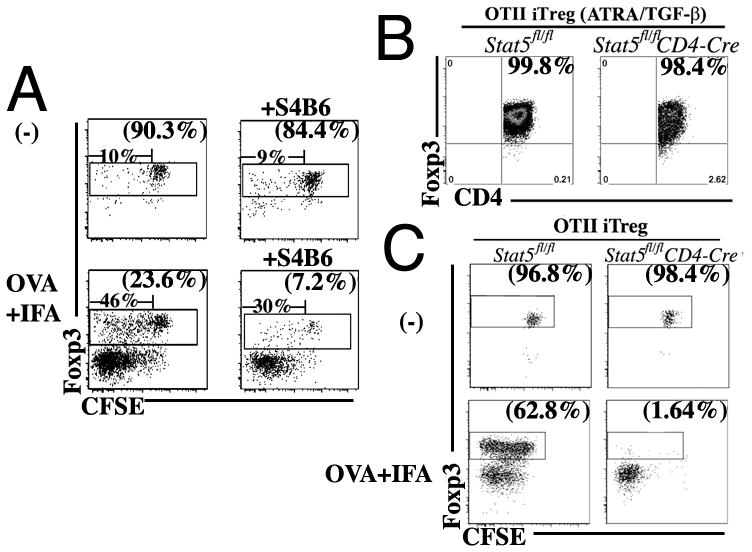
Stimulation of naive mouse CD4(+)Foxp3(-) T cells in the presence of TGF-β results in the induction of Foxp3 expression and T suppressor function. However, Foxp3 expression in these induced regulatory T cells (iTreg) is unstable, raising the possibility that iTreg would not be useful for treatment of autoimmune diseases. To analyze the factors that control the stability of Foxp3 expression in iTreg, we generated OVA-specific iTreg from OT-II Foxp3-GFP knockin mice. Following transfer to normal C57BL/6 mice, OT-II GFP(+) cells maintained high levels of Foxp3 expression for 8 d. However, they rapidly lost Foxp3 expression upon stimulation with OVA in IFA in vivo. This unstable phenotype was associated with a strong methylation of the Treg-specific demethylated region within the Foxp3 locus. Administration of IL-2/anti-IL-2 complexes expanded the numbers of transferred Foxp3(+) iTreg in the absence of Ag challenge. Notably, when the iTreg were stimulated with Ag, treatment with IL-2/anti-IL-2 complexes stabilized Foxp3 expression and resulted in enhanced demethylation of the Treg-specific demethylated region. Conversely, neutralization of IL-2 or disruption of its signaling by deletion of Stat5 diminished the level of Foxp3 expression resulting in decreased suppressor function of the iTreg in vivo. Our data suggest that stimulation with TGF-β in vitro is not sufficient for imprinting T cells with stable expression of Foxp3. Administration of IL-2 in vivo results in stabilization of Foxp3 expression and may prove to be a valuable adjunct for the use of iTreg for the treatment of autoimmune diseases.


Figures

Figure 1
Figure 1
Effects of IL-2 and TGF-β on the stabilization of Foxp3 expression in iTreg. A. Highly pure Foxp3+ iTreg populations were sorted based on GFP expression and were either re-stimulated with plate-bound anti-CD3/anti-CD28 antibodies and IL-2 in the absence (left) or presence (middle) of TGF-β or cultured with IL-2 alone (right). 3 days later, Foxp3 expression, CFSE dilution (upper panel) and IFN-γ production (lower panel) were assayed. B. Foxp3 expression was measured in induction cultures in the presence of TGF-β prior to sorting. On day 5, GFP+ cells were sorted and then restimulated with anti-CD3 and IL-2 or cultured in IL-2 alone. As controls, Foxp3 expression was measured in conventional T cells and in sorted nTreg that were cultured with plate-bound anti-CD3 antibody. Plot represents 3 independent experiments (mean + SD).
Figure 2
Figure 2
Kinetic analysis of Foxp3 expression in antigen-specific iTreg in DLNs. A. Antigen-specific GFP+ nTreg were sorted from OT-II transgenic Foxp3-GFP KI mice and transferred to normal recipients. 5 days after immunization, the transferred CD45.2+ cells (left) were analyzed for Foxp3 expression and CFSE dilution (middle). Numbers in brackets represent the percentage of Foxp3+ cells. Individual peaks on the CFSE histogram profile (right) were analyzed from the gated Foxp3+ cells, shown as percentage of the cells within the peak. B. Antigen-specific iTreg were generated from sorted GFPCD4+ T cells from the mice described in panel A. Foxp3+ iTreg (CD45.2+) were sorted 5 days later, labeled with CFSE, and injected i.v. into CD45.1 recipients. Recipients were either untreated (upper panel) or immunized (lower panel) with OVA323–339 in IFA. On day 1, 3, 5, and 8 after injection, DLNs were harvested and analyzed for expression of CD45.1 and CD45.2. C. GFP fluorescence was quenched through fixation and permeabilization. Foxp3 expression among the gated CD45.2 population was analyzed by intracellular staining. Numbers in brackets represent the percentage of Foxp3+ cells. Proliferation was measured as the percentage of cells that diluted CFSE within gated Foxp3+ cells. The small fraction of cells displaying CFSElow one day after restimulation likely represents dead cells. D. The absolute numbers of transferred cells remained in the DLNs were calculated by multiplying the percentages of CD45.2+ cells by the total cell number in the DLNs; CD45.2+Foxp3+ cells were similarly calculated. Data represent 3 independent experiments (mean + SD). E. On day5 after transfer, IL-17A, IFN-γ and IL-2 production by the adoptively transferred cells in DLNs was measured following stimulation with PMA/ionomycin.
Figure 3
Figure 3
Lack of evidence for stable Foxp3 expression in an iTreg subpopulation. A. OT-II GFP+ iTreg (CD45.2+) were induced, sorted and adoptively transferred to recipients (CD45.1+). The recipients were all immunized with OVA/IFA. 5 days later, CD45.2+GFP+ were sorted from the DLN and transferred to a second group of recipients and left untreated or immunized with OVA/IFA. B. 4 days later, the DLN were harvested and the percentages of CD45.2+Foxp3+ T cells were determined. Data were representative of 3 different experiments with similar results.
Figure 4
Figure 4
The strength of the TCR signal determines the stability of Foxp3 expression in iTreg in vivo. Antigen-specific iTreg were generated as in Fig. 2. CD11c+ splenic DCs were pulsed with varying concentrations of OVA323–339 for 1h at 37°C and then co-transferred with the iTreg (DC:iTreg 1:20, upper panel) into normal recipients. In the lower panel, the DC were pulsed with OVA (0.1 mM OVA323–339)) and co-transferred with iTreg at DCs:iTreg ratios of 1:40 or 1:5. 5 days after transfer, the donor cells were isolated from spleen and analyzed for the expression of Foxp3 and CFSE dilution. Numbers in brackets on the right corner represent the percentage of Foxp3+ cells. Proliferation was shown as the percentage of cells that diluted CFSE within gated Foxp3+ cells. Data were representative of 2 different experiments with similar results.
Figure 5
Figure 5
IL-2/anti-IL-2 complexes stabilize Foxp3 expression and induce demethylation of the TSDR in iTreg. A. OT-II iTreg (CD45.2+) were CFSE-labeled and transferred into CD45.1+ mice. On day 0, recipients were left untreated or immunized with OVA/IFA. IL-2/anti-IL-2 complexes were injected i.p. daily for 3 d (days 0, 1, and 2). 5 days after transfer, DLNs were harvested and analyzed for expression of Foxp3 and CFSE dilution. Numbers in brackets represent the percentage of Foxp3+ cells (upper panel). Proliferation was analyzed as the percentage of cells that diluted CFSE. From the gated Foxp3+ cells, individual peaks on the CFSE histogram profile were analyzed (lower panel), showing the percentage of cells within the peak. B. The absolute numbers of transferred cells and CD45.2+Foxp3+ were calculated as in Fig. 2. Data represent 3 different experiments (mean + SD). C. The transferred cells were sorted into different population based on the expression of GFP and subjected to methylation analysis. As controls, GFP+ nTreg and GFP conventional CD4+ T cells that had been activated by plate-bound anti-CD3/anti-CD28 were adoptively transferred into recipients and left untreated. 5 days later, the GFP+ or GFP donor cells were isolated. The results are expressed as the mean percentage of methylation of CpG motifs. Value represents the mean +/− SD of triplicate samples. Similar results were seen in one other experiment.
Figure 6
Figure 6
Neutralization of IL-2 or Stat5 signaling negatively regulates Foxp3 expression in iTreg. A. OT-II iTreg (CD45.2+) were CFSE-labeled and transferred into CD45.1+ recipients. The recipients were immunized with OVA/IFA and left untreated or injected i.p. with 500 μg of anti-IL-2 mAb S4B6 (days 0 and 1) to neutralize endogenous IL-2. 5 days after transfer, DLNs were harvested and analyzed for expression of Foxp3 and CFSE dilution. Numbers in brackets represent the percentage of Foxp3+ cells. Proliferation was shown as the percentage of cells that diluted CFSE within gated Foxp3+ cells. B. Vα2+Vβ5+ OT-II transgenic CD4+CD25 T cells sorted from OT-II TCR Tg Stat5fl/fl control (right) or Stat5fl/fl CD4-Cre (left) mice were stimulated for 4 days in culture with plate-bound anti-CD3/anti-CD28 antibodies and IL-2 in the presence of TGF-β and ATRA. Foxp3 expression was measured on fixed cells by intracellular staining. C. The antigen-specific iTreg induced from B (CD45.2+) were CFSE-labeled and transferred into CD45.1+ mice. The recipients were then immunized with OVA/IFA as indicated. 5 days later, Foxp3 expression and CFSE dilution of the adoptively transferred cells were analyzed. Data were representative of 3 different experiments with similar results.
Figure 7
Figure 7
Neutralization of IL-2 negatively regulates Foxp3 expression and suppressor function of antigen-specific iTreg in vivo. A. Schematic diagram of the adoptive transfer protocol. Naïve OT-II CD4+Foxp3 CD45.1+ Thy1.2+ (0.5×10⁶ cells) were CFSE-labeled and either mixed with activated OT-II conventional CD4+CD45.2+Thy1.2+ or iTreg (3×10⁶ cells) and transferred into the Thy1.1+ mice. Recipients were immunized with OVA/IFA and left untreated or injected i.p. with 500 μg of anti-IL-2 (day 0 and 1). B. 5 days after transfer, DLNs were harvested and CFSE dilution of the transferred effector CD4+CD45.1+ Thy1.2+ measured. CFSE-dilution and expression of Foxp3 in the CD45.2+ Thy1.2+ populations was also measured. C. The absolute numbers of transferred effector CD4+ in the DLNs were calculated by multiplying the percentages of CD45.1+Thy1.2+ cells by the total cell number of DLNs. Data represent 3 different experiments (mean + SD).

References

    1. Fontenot JD, Gavin MA, Rudensky AY. Foxp3 programs the development and function of CD4+CD25+ regulatory T cells. Nat Immunol. 2003;4:330–336. - PubMed
    1. Zheng Y, Rudensky AY. Foxp3 in control of the regulatory T cell lineage. Nat Immunol. 2007;8:457–462. - PubMed
    1. Chen W, Jin W, Hardegen N, Lei KJ, Li L, Marinos N, McGrady G, Wahl SM. Conversion of peripheral CD4+CD25− naive T cells to CD4+CD25+ regulatory T cells by TGF-beta induction of transcription factor Foxp3. J Exp Med. 2003;198:1875–1886. - PMC - PubMed
    1. Fantini MC, Becker C, Monteleone G, Pallone F, Galle PR, Neurath MF. Cutting edge: TGF-beta induces a regulatory phenotype in CD4+CD25− T cells through Foxp3 induction and down-regulation of Smad7. J Immunol. 2004;172:5149–5153. - PubMed
    1. Curotto de Lafaille MA, Lino AC, Kutchukhidze N, Lafaille JJ. CD25− T cells generate CD25+Foxp3+ regulatory T cells by peripheral expansion. J Immunol. 2004;173:7259–7268. - PubMed

Publication types

MeSH terms