

Rapid evolution of disease resistance is accompanied by functional changes in gene expression in a wild bird
- PMID: 21525409
- PMCID: PMC3093480
- DOI: 10.1073/pnas.1018580108
Rapid evolution of disease resistance is accompanied by functional changes in gene expression in a wild bird
Abstract
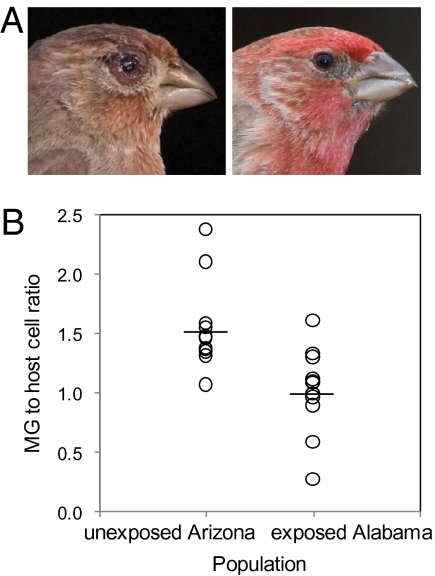
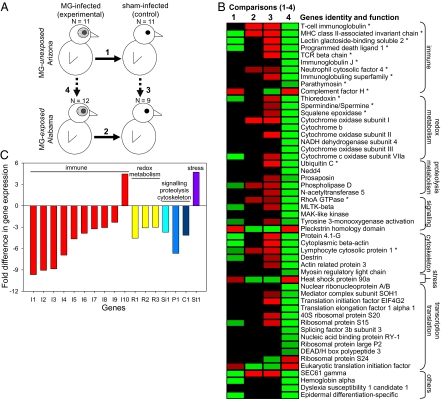
Wild organisms are under increasing pressure to adapt rapidly to environmental changes. Predicting the impact of these changes on natural populations requires an understanding of the speed with which adaptive phenotypes can arise and spread, as well as of the underlying mechanisms. However, our understanding of these parameters is poor in natural populations. Here we use experimental and molecular approaches to investigate the recent emergence of resistance in eastern populations of North American house finches (Carpodacus mexicanus) to Mycoplasma galliseptum (MG), a severe conjunctivitis-causing bacterium. Two weeks following an experimental infection that took place in 2007, finches from eastern US populations with a 12-y history of exposure to MG harbored 33% lower MG loads in their conjunctivae than finches from western US populations with no prior exposure to MG. Using a cDNA microarray, we show that this phenotypic difference in resistance was associated with differences in splenic gene expression, with finches from the exposed populations up-regulating immune genes postinfection and those from the unexposed populations generally down-regulating them. The expression response of western US birds to experimental infection in 2007 was more similar to that of the eastern US birds studied in 2000, 7 y earlier in the epizootic, than to that of eastern birds in 2007. These results support the hypothesis that resistance has evolved by natural selection in the exposed populations over the 12 y of the epizootic. We hypothesize that host resistance arose and spread from standing genetic variation in the eastern US and highlight that natural selection can lead to rapid phenotypic evolution in populations when acting on such variation.
Conflict of interest statement
The authors declare no conflict of interest.
Figures
References
-
- Walther GR, et al. Ecological responses to recent climate change. Nature. 2002;416:389–395. - PubMed
-
- Reznick DN, Shaw FH, Rodd FH, Shaw RG. Evaluation of the rate of evolution in natural populations of guppies (Poecilia reticulata) Science. 1997;275:1934–1937. - PubMed
-
- Grant PR, Grant BR. Evolution of character displacement in Darwin's finches. Science. 2006;313:224–226. - PubMed
-
- Badyaev AV. Maternal effects as generators of evolutionary change: A reassessment. Ann N Y Acad Sci. 2008;1133:151–161. - PubMed
-
- Falconer DS, Mackay TFC. Introduction to Quantitative Genetics. 4th Ed. Harlow, Essex, UK: Longmans Green; 1996.
Publication types
MeSH terms
Associated data
- Actions
- Actions
- Actions
- Actions
- Actions
- Actions
- Actions
- Actions
- Actions
- Actions
- Actions
- Actions
- Actions
- Actions
- Actions
- Actions
- Actions
- Actions
- Actions
- Actions
- Actions
- Actions
- Actions
- Actions
- Actions
- Actions
- Actions
- Actions
- Actions
- Actions
- Actions
- Actions
- Actions
- Actions
- Actions
- Actions
- Actions
- Actions
- Actions
- Actions
- Actions
- Actions
- Actions
- Actions
- Actions
- Actions
- Actions
- Actions
- Actions
- Actions
- Actions
- Actions
- Actions
- Actions
- Actions
- Actions
- Actions
- Actions
- Actions
- Actions
- Actions
- Actions
- Actions
- Actions
- Actions
- Actions
- Actions
- Actions
- Actions
- Actions
- Actions
- Actions
- Actions
- Actions
- Actions
- Actions
- Actions
- Actions
- Actions
- Actions
- Actions
- Actions
- Actions
- Actions
- Actions
- Actions
- Actions
- Actions
- Actions
- Actions
- Actions
- Actions
- Actions
- Actions
- Actions
LinkOut - more resources
Full Text Sources
