. 2011 Apr 28;472(7344):443-7.
doi: 10.1038/nature10009.

Local sleep in awake rats

Affiliations

Local sleep in awake rats

Vladyslav V Vyazovskiy et al. Nature. .

Abstract

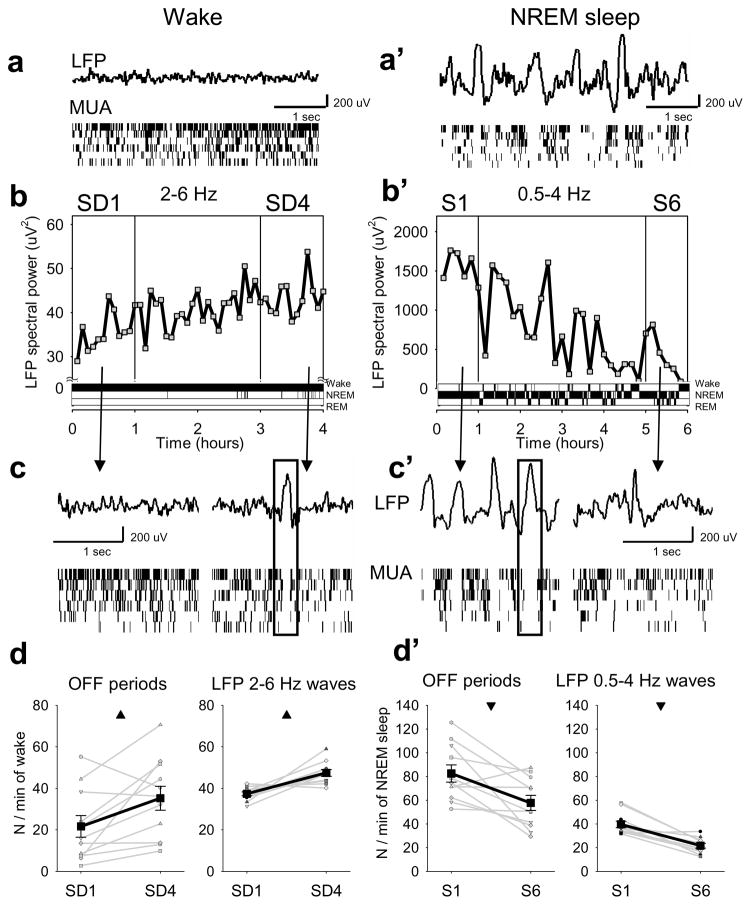
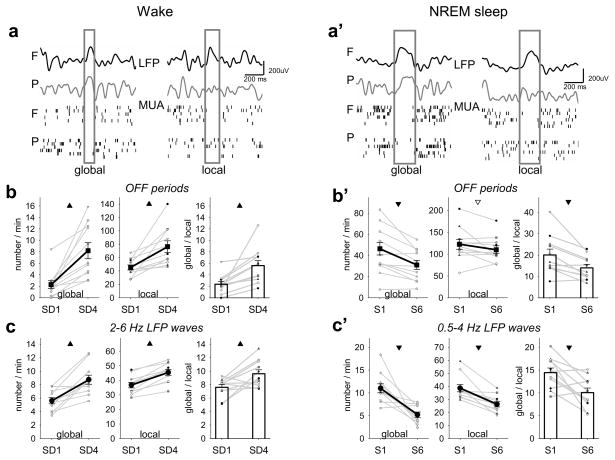
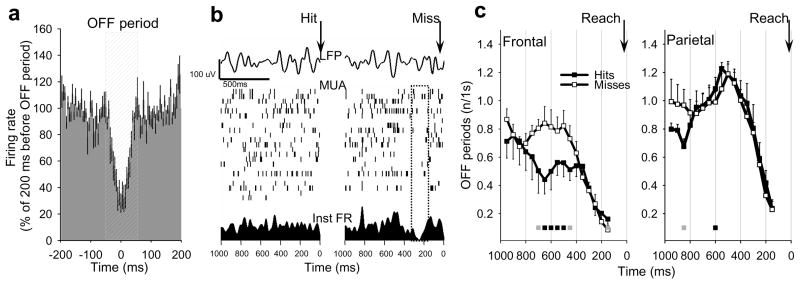
In an awake state, neurons in the cerebral cortex fire irregularly and electroencephalogram (EEG) recordings display low-amplitude, high-frequency fluctuations. During sleep, neurons oscillate between 'on' periods, when they fire as in an awake brain, and 'off' periods, when they stop firing altogether and the EEG displays high-amplitude slow waves. However, what happens to neuronal firing after a long period of being awake is not known. Here we show that in freely behaving rats after a long period in an awake state, cortical neurons can go briefly 'offline' as in sleep, accompanied by slow waves in the local EEG. Neurons often go offline in one cortical area but not in another, and during these periods of 'local sleep', the incidence of which increases with the duration of the awake state, rats are active and display an 'awake' EEG. However, they are progressively impaired in a sugar pellet reaching task. Thus, although both the EEG and behaviour indicate wakefulness, local populations of neurons in the cortex may be falling asleep, with negative consequences for performance.


Conflict of interest statement

COI statement: All authors indicated no financial conflicts of interest.

Figures

Figure 1
Figure 1. OFF periods in sleep and wake
a, a, LFP records from frontal cortex and raster plots of corresponding multiunit activity (MUA; 6 putative neurons, each vertical line is a spike). b, time course of wake LFP slow/theta power (2–6 Hz) for consecutive 5-min bins during 4h of sleep deprivation in one rat. b′, time course of LFP slow wave activity (0.5–4 Hz) plotted for consecutive 5-min bins during 6h of recovery after sleep deprivation in the same rat. Note different Y-axis scale in b and b′. Bottom: corresponding hypnograms. c, c, LFP records in wake at the beginning (SD1) and end (SD4) of sleep deprivation, and in NREM sleep at the beginning (S1) and end (S6) of recovery. Bottom: corresponding MUA raster plots. d, d, left, changes in OFF periods and 2–6 Hz waves in wake, and of OFF periods and 0.5–4 Hz waves in NREM sleep. Black lines: mean (SEM, n=11 rats); grey lines: individual rats. Triangles depict significant differences (wake, OFF periods: F (1,21)=7.03, p=0.024; 2–6 Hz LFP waves: F (1,21)=18.61, p=0.0015; NREM sleep, OFF periods: F (1,21)=10.40, p=0.009; 0.5–4 Hz LFP waves: F (1,21)=34.83, p=1.5069e-004, fixed-effects model ANOVA).
Figure 2
Figure 2. Local wake OFF periods
a, top: wake LFP records in frontal (F) and parietal (P) cortex, depicting global or local frontal 2–6 Hz waves (boxed); bottom, raster plots of corresponding MUA. a, top: LFP records in NREM sleep depicting global or local frontal slow waves (boxed); bottom: raster plots of corresponding MUA. b, left and middle: change in global and local OFF periods during sleep deprivation (mean, n=7 rats, 1–3 experiments/rat). Triangles here and in the next panels depict differences at a significant (filled) or tendency (open) level (global OFF periods: F(1,21)=94.95, p=0.0104; local OFF periods: F(1,21)=20.08, p=0.0464). Right: number of global OFF periods (as % of local, F+P) during SD1 and SD4 (F(1,21)=67.05, p=0.0146, fixed-effects model ANOVA). b, left and middle: change in global and local OFF periods during NREM sleep (mean, n=7 rats, 1–3 experiments/rat; global OFF periods: F(1,21)=60.72, p=0.0161; local OFF periods: F(1,21)=11.56, p=0.0767). Right: number of global OFF periods (as % of local, F+P) during S1 and S6 (F(1,21)=99.17, p=0.0099, fixed-effects model ANOVA). Note different Y-axis scale in b and b′. c, left and middle: changes in global and local waves from SD1 to SD4 (mean, n=7 rats, 1–3 experiments per rat, SEM; global waves: F(1,21)=34.08, p=0.0281; local waves: F(1,21)=28.54, p=0.0333). Right: number of global waves (as % of local, F+P) during SD1 and SD4 (F(1,21)=52.53, p=0.0185, fixed-effects model ANOVA). c′, left and middle: changes in global and local waves during NREM sleep (mean, n=7 rats, 1–3 experiments/rat, SEM; global waves: F(1,21)=254.42, p=0.0039; local waves: F(1,21)=529.31, p=0.0019). Right: number of global waves (as % of local, F+P) during S1 and S6 (F(1,21)= 37.38, p=0.0253, fixed-effects model ANOVA). Note different Y-axis scale in c and c′.
Figure 3
Figure 3. Wake OFF periods affect performance
a, average neuronal activity in frontal cortex triggered by the OFF periods (mean, SEM, n=6 rats; shown as % of mean firing rate in the last 200 ms before the OFF period). b, top: individual examples of frontal LFP records immediately preceding a successful or unsuccessful reaching attempts (Hit or Miss, arrows); middle, raster plots of corresponding MUA; bottom: instantaneous firing rates of the entire population (20 putative neurons). Note a generalized suppression of firing before Miss. c, number of OFF periods before Hits or Misses (frontal, n=6 rats; parietal, n=5 rats). Average values are plotted for consecutive overlapping 300ms windows with 50ms shifts against the midpoint of the corresponding window (e.g. the value at 500 ms depicts the number of OFF periods occurring between 350 and 650 ms). Squares show significant differences between Hits and Misses (grey: p<0.1, black: p<0.05, rANOVA).

Comment in

  • Neuroscience: Sleepy neurons?
    Colwell CS. Colwell CS. Nature. 2011 Apr 28;472(7344):427-8. doi: 10.1038/472427a. Nature. 2011. PMID: 21525924 No abstract available.
  • Sleep: Neurons take a nap.
    Welberg L. Welberg L. Nat Rev Neurosci. 2011 Jun;12(6):305. doi: 10.1038/nrn3048. Epub 2011 May 18. Nat Rev Neurosci. 2011. PMID: 21587286 No abstract available.

References

    1. Steriade M, Timofeev I, Grenier F. Natural waking and sleep states: a view from inside neocortical neurons. J Neurophysiol. 2001;85(5):1969–1985. - PubMed
    1. Dijk DJ, Duffy JF, Czeisler CA. Circadian and sleep/wake dependent aspects of subjective alertness and cognitive performance. J Sleep Res. 1992;1(2):112–117. - PubMed
    1. Van Dongen HP, Maislin G, Mullington JM, Dinges DF. The cumulative cost of additional wakefulness: dose-response effects on neurobehavioral functions and sleep physiology from chronic sleep restriction and total sleep deprivation. Sleep. 2003;26(2):117–126. - PubMed
    1. Borbély AA, Achermann P. Sleep homeostasis and models of sleep regulation. In: Kryger MH, Roth T, Dement WC, editors. Principles and Practice of Sleep Medicine. W. B. Saunders; Philadelphia: 2005. pp. 405–417.
    1. Dang-Vu TT, et al. Functional neuroimaging insights into the physiology of human sleep. Sleep. 2010;33(12):1589–1603. - PMC - PubMed

Publication types