. 2011 Apr 22;6(4):e18921.
doi: 10.1371/journal.pone.0018921.

Mature peripheral RPE cells have an intrinsic capacity to proliferate; a potential regulatory mechanism for age-related cell loss

Affiliations

Mature peripheral RPE cells have an intrinsic capacity to proliferate; a potential regulatory mechanism for age-related cell loss

Ioannis Kokkinopoulos et al. PLoS One. .

Abstract

Background: Mammalian peripheral retinal pigmented epithelium (RPE) cells proliferate throughout life, while central cells are senescent. It is thought that some peripheral cells migrate centrally to correct age-related central RPE loss.

Methodology/principal findings: We ask whether this proliferative capacity is intrinsic to such cells and whether cells located centrally produce diffusible signals imposing senescence upon the former once migrated. We also ask whether there are regional differences in expression patterns of key genes involved in these features between the centre and the periphery in vivo and in vitro. Low density RPE cultures obtained from adult mice revealed significantly greater levels of proliferation when derived from peripheral compared to central tissue, but this significance declined with increasing culture density. Further, exposure to centrally conditioned media had no influence on proliferation in peripheral RPE cell cultures at the concentrations examined. Central cells expressed significantly higher levels of E-Cadherin revealing a tighter cell adhesion than in the peripheral regions. Fluorescence-labelled staining for E-Cadherin, F-actin and ZO-1 in vivo revealed different patterns with significantly increased expression on central RPE cells than those in the periphery or differences in junctional morphology. A range of other genes were investigated both in vivo and in vitro associated with RPE proliferation in order to identify gene expression differences between the centre and the periphery. Specifically, the cell cycle inhibitor p27(Kip1) was significantly elevated in central senescent regions in vivo and mTOR, associated with RPE cell senescence, was significantly elevated in the centre in comparison to the periphery.

Conclusions: These data show that the proliferative capacity of peripheral RPE cells is intrinsic and cell-autonomous in adult mice. These differences between centre and periphery are reflected in distinct patterns in junctional markers. The regional proliferation differences may be inversely dependent to cell-cell contact.


Conflict of interest statement

Competing Interests: The authors have declared that no competing interests exist.

Figures

Figure 1
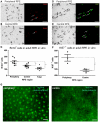
Figure 1. Peripheral RPE cells proliferate in vivo and in vitro.
The adult mouse RPE was investigated to confirm it contains a peripheral region where cell division occurs. Animals were given daily BrdU injections for 5 consecutive days and were sacrificed 1, 2, 3 and 4 weeks after the last injection day. (A) Photomicrograph of the RPE flatmount indicating, in the circle, the peripheral region in which BrdU+ RPE cells were found. The dotted white line illustrates the peripheral and central RPE zones. (B) Higher magnification showing cells positive for BrdU (in red). (C) RPE cells were cultured for 9 days and on final day they received a single 4-hour BrdU pulse prior to fixation. The majority of cells expressed Otx2 (RPE-specific marker, red), with a number of cells also co-expressing BrdU (green). Scale bar = 5 µm. N (number of eyes examined) = 3.
Figure 2
Figure 2. Peripheral, central and total RPE cell cultures have different proliferation profiles.
Peripheral, central and total RPE cells were cultured for 9 days then received a single 4-hour BrdU pulse prior to fixation. Representative microphotographs of BrdU-labelled cultures of (A) peripheral RPE cells and (B) central RPE cells. White arrows indicate pigmented BrdU+ cells. (C) A graph indicating the number of BrdU+ cells in cultures harvested from each region (Peripheral: circles. Central: squares. Total: triangles). Mann-Whitney Test; *p = 0.02, **p = 0.04. No statistical significance was found between central and total RPE BrdU+ cells counts. Error bars = SEM. Peripheral and central RPE cells were cultured as above for 3 days, fixed and immuno-stained with Ki67. Representative microphotographs of Ki67+ cells of (D) peripheral cells and (E) central cells. White arrows indicate Ki67+ cells. The number of Ki67+ cells counted from each region is shown in Figure 2F where cell densities in the two cultures were similar (Periphery: circle points. Central; square points). Mann-Whitney Test; *p = 0.05. Error bars = SD. In A–C, when labelled cell numbers are normalised against the total cell number for the two regions the differences remain significantly different (Mann-Whitney Test; BrdU+/total cell number - Periphery against Centre; p = 0.037 and Ki67+/total cell number - Periphery against Centre; p = 0.0237). In vivo protein expression of active (phosphorylated) beta-catenin in peripheral and central RPE (G). N = 3 eyes. Scale bars = 5 µm.
Figure 3
Figure 3. Central RPE cells do not inhibit peripheral RPE cells from proliferating via diffusible signals.
RPE cultures were setup from peripheral and central RPE and were allowed to proliferate at low density for one week, before peripheral RPE cultures were introduced to central RPE medium for two days before a 4-hour BrdU pulse. (A) The graph indicates the number of BrdU+ cells per region per total cell number. Periphery (circle points), central (square points) and control periphery (triangle points). Cell number per culture; 5,000 cells/well. Mann-Whitney Test; *p = 0.03. **p = 0.02. Peripheral RPE versus control RPE periphery was not found to be statistically significant (p = 0.68). Error bars = SD. (B) RPE cultures were setup from peripheral and central RPE and allowed to proliferate at high density for one week, before peripheral RPE cultures were introduced to central RPE medium for two days before a 4-hour BrdU pulse. The graph indicates the number of BrdU+ cells per region. Periphery (circle points), central (square points) and control periphery (triangle points). Cell number per culture; 10,000 cells/well. Error bars = SD.
Figure 4
Figure 4. Quantitative Real-Time PCR analysis of gene expression in peripheral and central RPE tissue and cell cultures.
Gene expression of p27kip1 (Ai.), Cyclin D1 (Bi.), and mTOR (Ci.), in RPE tissue obtained from the periphery and centre of adult mouse RPE. Gene expression of p27kip1 (Aii.), Cyclin D1 (Bii.), and mTOR (Cii.) in cultured cells obtained from the periphery and centre of adult mouse RPE. Graphs show relative gene expression levels from independent samples normalized to ACTB (at least 6 independent samples obtained from each region); Mann-Whitney Test, * P<0.05 in each case.
Figure 5
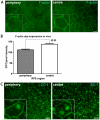
Figure 5. Gene and protein expression profile in peripheral and central RPE tissue of E-Cadherin.
Gene expression of E-Cadherin, in RPE tissue obtained from the periphery and centre of adult mouse RPE in vivo (A) and in vitro (B). Graph shows relative expression levels from independent samples normalized to ACTB (n is at least 4 from each region). Protein expression of E-Cadherin (FITC) on adult mouse RPE flatmounts (C) and a graph showing FITC/pixel intensity from each RPE region (D). Central cells consistently expressed greater levels of E-Cadherin than those in the periphery. Inserts show individual RPE cells in higher magnification. N = 3 eyes. Scale bar = 5 µm. Mann-Whitney Test, * P<0.05, **p<0.002. Error bars = SEM.
Figure 6
Figure 6. Protein expression profile in peripheral and central RPE tissue of F-actin and ZO-1 junctional markers.
Phalloidin (F-actin) dye (FITC) expression on adult mouse RPE flatmounts (A) and a graph showing FITC/pixel intensity from each RPE region (B). Greater levels of F-actin were present on junctions centrally than in the periphery. Protein expression profile of ZO-1 in peripheral and central RPE (C). Inserts show individual RPE cells in higher magnification. ZO-1 is distributed less regularly in the periphery that in the centre. N = 3 eyes. Scale bar = 5 µm. Mann-Whitney Test, **p<0.002. Error bars = SEM.
Figure 7
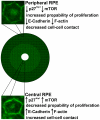
Figure 7. Schematic graph of the adult mouse RPE and characteristics of peripheral and central RPE cells.
Peripheral and Central RPE cells express different levels of genes that play crucial role in cell proliferation. The levels of protein and gene expression for key cell adhesion molecules is also different between these two RPE populations, indicating distinct cell-cell contact behaviour.

References

    1. Raymond SM, Jackson IJ. The retinal pigmented epithelium is required for development and maintenance of the mouse neural retina. Curr Biol. 1995;5:1286–1295. - PubMed
    1. Elman MJ, Fine SL, Murphy RP, Patz A, Auer C. The natural history of serous retinal pigment epithelium detachment in patients with age-related macular degeneration. Ophthalmology. 1986;93:224–230. - PubMed
    1. Lai YL, Rana MW. A study of photoreceptor-retinal pigment epithelium complex: age-related changes in monkeys. Proc Soc Exp Biol Med. 1986;181:371–381. - PubMed
    1. Tolmachova T, Wavre-Shapton ST, Barnard AR, MacLaren RE, Futter CE, et al. Retinal pigment epithelium defects accelerate photoreceptor degeneration in cell type-specific knockout mouse models of choroideremia. Invest Ophthalmol Vis Sci. 2010;51:4913–4920. - PMC - PubMed
    1. Young RW. The ninth Frederick H. Verhoeff lecture. The life history of retinal cells. Trans Am Ophthalmol Soc. 1983;81:193–228. - PMC - PubMed

Publication types

MeSH terms