

The genetic effect of copy number variations on the risk of type 2 diabetes in a Korean population
- PMID: 21526130
- PMCID: PMC3081314
- DOI: 10.1371/journal.pone.0019091
The genetic effect of copy number variations on the risk of type 2 diabetes in a Korean population
Abstract
Background: Unlike Caucasian populations, genetic factors contributing to the risk of type 2 diabetes mellitus (T2DM) are not well studied in Asian populations. In light of this, and the fact that copy number variation (CNV) is emerging as a new way to understand human genomic variation, the objective of this study was to identify type 2 diabetes-associated CNV in a Korean cohort.
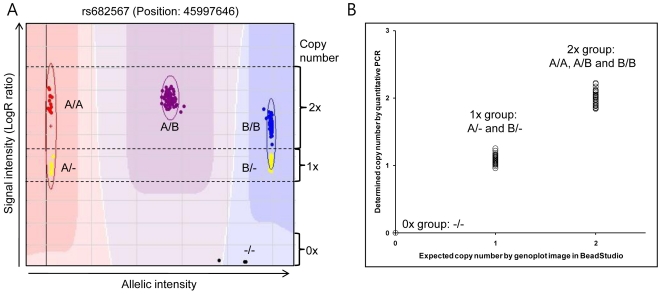
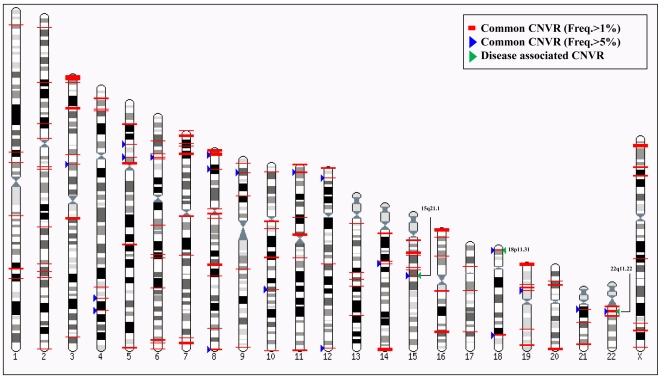
Methodology/principal findings: Using the Illumina HumanHap300 BeadChip (317,503 markers), genome-wide genotyping was performed to obtain signal and allelic intensities from 275 patients with type 2 diabetes mellitus (T2DM) and 496 nondiabetic subjects (Total n = 771). To increase the sensitivity of CNV identification, we incorporated multiple factors using PennCNV, a program that is based on the hidden Markov model (HMM). To assess the genetic effect of CNV on T2DM, a multivariate logistic regression model controlling for age and gender was used. We identified a total of 7,478 CNVs (average of 9.7 CNVs per individual) and 2,554 CNV regions (CNVRs; 164 common CNVRs for frequency>1%) in this study. Although we failed to demonstrate robust associations between CNVs and the risk of T2DM, our results revealed a putative association between several CNVRs including chr15:45994758-45999227 (P = 8.6E-04, P(corr) = 0.01) and the risk of T2DM. The identified CNVs in this study were validated using overlapping analysis with the Database of Genomic Variants (DGV; 71.7% overlap), and quantitative PCR (qPCR). The identified variations, which encompassed functional genes, were significantly enriched in the cellular part, in the membrane-bound organelle, in the development process, in cell communication, in signal transduction, and in biological regulation.
Conclusion/significance: We expect that the methods and findings in this study will contribute in particular to genome studies of Asian populations.
Conflict of interest statement
Figures
Similar articles
-
The genetic effect of copy number variations on the risk of alcoholism in a Korean population.Alcohol Clin Exp Res. 2012 Jan;36(1):35-42. doi: 10.1111/j.1530-0277.2011.01578.x. Epub 2011 Jul 25. Alcohol Clin Exp Res. 2012. PMID: 21790672
-
Genome-wide association analysis of copy number variations in subarachnoid aneurysmal hemorrhage.J Hum Genet. 2010 Nov;55(11):726-30. doi: 10.1038/jhg.2010.97. Epub 2010 Aug 12. J Hum Genet. 2010. PMID: 20703242
-
Identification of genome-wide copy number variations and a family-based association study of Avellino corneal dystrophy.Ophthalmology. 2010 Jul;117(7):1306-12.e4. doi: 10.1016/j.ophtha.2009.11.021. Epub 2010 Mar 3. Ophthalmology. 2010. PMID: 20202685
-
A Genome Wide Study of Copy Number Variation Associated with Nasopharyngeal Carcinoma in Malaysian Chinese Identifies CNVs at 11q14.3 and 6p21.3 as Candidate Loci.PLoS One. 2016 Jan 5;11(1):e0145774. doi: 10.1371/journal.pone.0145774. eCollection 2016. PLoS One. 2016. PMID: 26730743 Free PMC article.
-
Genome wide copy number variations using Porcine 60K SNP Beadchip in Landlly pigs.Anim Biotechnol. 2023 Nov;34(6):1891-1899. doi: 10.1080/10495398.2022.2056047. Epub 2022 Apr 4. Anim Biotechnol. 2023. PMID: 35369845 Review.
Cited by
-
Identification of biomarkers associated with immune scores in diabetic retinopathy.Front Endocrinol (Lausanne). 2023 Oct 5;14:1228843. doi: 10.3389/fendo.2023.1228843. eCollection 2023. Front Endocrinol (Lausanne). 2023. PMID: 37867507 Free PMC article.
-
Detection of CAPN10 copy number variation in Thai patients with type 2 diabetes by denaturing high performance liquid chromatography and real-time quantitative polymerase chain reaction.J Diabetes Investig. 2015 Nov;6(6):632-9. doi: 10.1111/jdi.12341. Epub 2015 Mar 24. J Diabetes Investig. 2015. PMID: 26543536 Free PMC article.
-
The role of AMY1 gene copy number variation in dental caries susceptibility: insights from a Turkish population.BMC Oral Health. 2025 May 14;25(1):722. doi: 10.1186/s12903-025-06074-3. BMC Oral Health. 2025. PMID: 40369510 Free PMC article.
-
Genetic Determinants of Type 2 Diabetes in Asians.Int J Diabetol Vasc Dis Res. 2015;2015(Suppl 1):10.19070/2328-353X-SI01001. doi: 10.19070/2328-353X-SI01001. Epub 2015 Mar 12. Int J Diabetol Vasc Dis Res. 2015. PMID: 27583258 Free PMC article.
-
Unique characteristics of the Ainu population in Northern Japan.J Hum Genet. 2015 Oct;60(10):565-71. doi: 10.1038/jhg.2015.79. Epub 2015 Jul 16. J Hum Genet. 2015. PMID: 26178428
References
-
- Wild S, Roglic G, Green A, Sicree R, King H. Global prevalence of diabetes: estimates for the year 2000 and projections for 2030. Diabetes Care. 2004;27:1047–1053. - PubMed
-
- Elbein SC. Perspective: the search for genes for type 2 diabetes in the post-genome era. Endocrinology. 2002;143:2012–2018. - PubMed
-
- Groop LC, Tuomi T. Non-insulin-dependent diabetes mellitus—a collision between thrifty genes and an affluent society. Ann Med. 1997;29:37–53. - PubMed
-
- Barroso I. Genetics of Type 2 diabetes. Diabet Med. 2005;22:517–535. - PubMed
-
- Ahlqvist E, Ahluwalia TS, Groop L. Genetics of Type 2 Diabetes. Clin Chem. 2011;57 - PubMed
Publication types
MeSH terms
LinkOut - more resources
Full Text Sources
Medical
