. 2011 Apr 22;6(4):e18359.
doi: 10.1371/journal.pone.0018359.

Multiple changes in peptide and lipid expression associated with regeneration in the nervous system of the medicinal leech

Affiliations

Multiple changes in peptide and lipid expression associated with regeneration in the nervous system of the medicinal leech

Céline Meriaux et al. PLoS One. .

Abstract

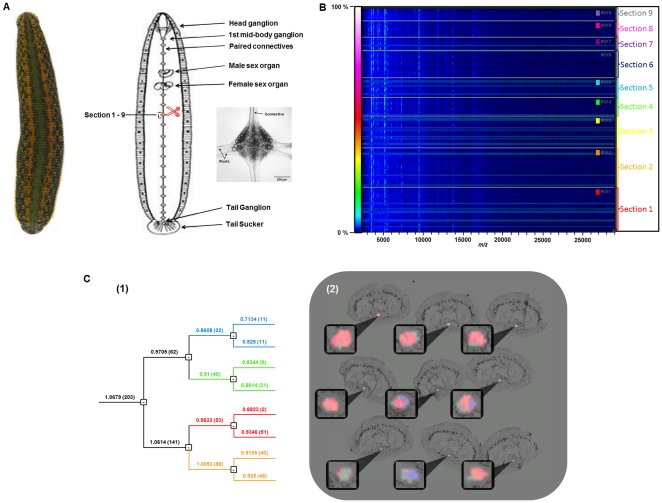
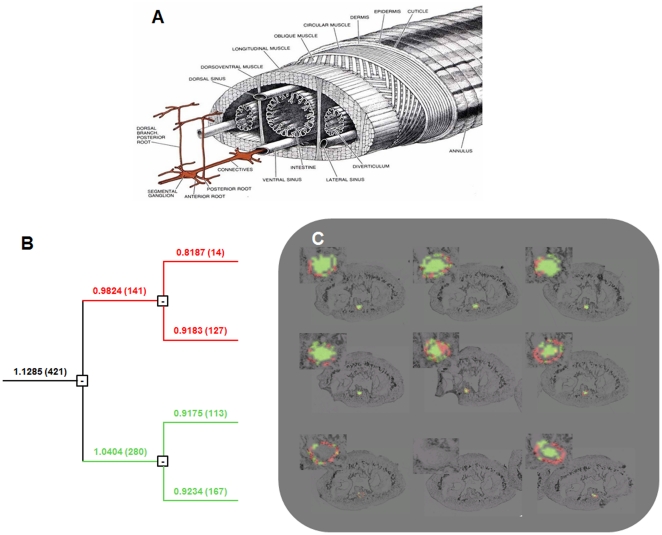
Background: The adult medicinal leech central nervous system (CNS) is capable of regenerating specific synaptic circuitry after a mechanical lesion, displaying evidence of anatomical repair within a few days and functional recovery within a few weeks. In the present work, spatiotemporal changes in molecular distributions during this phenomenon are explored. Moreover, the hypothesis that neural regeneration involves some molecular factors initially employed during embryonic neural development is tested.

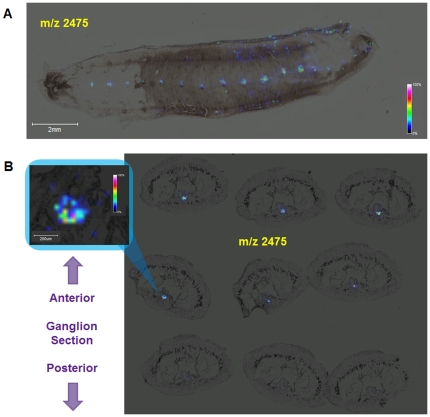
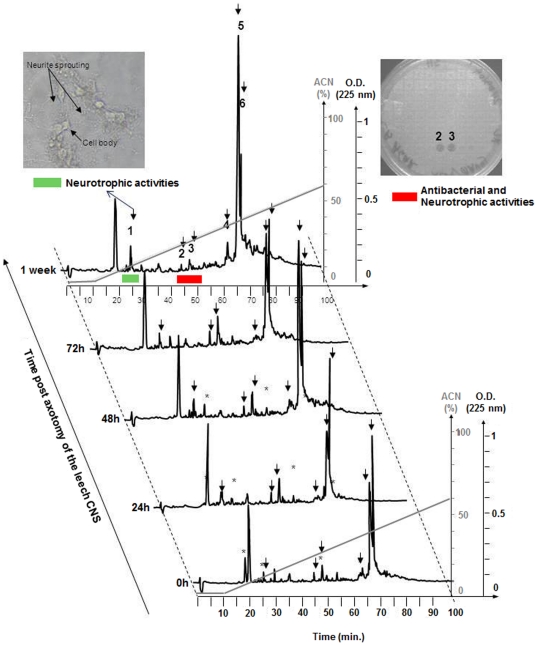
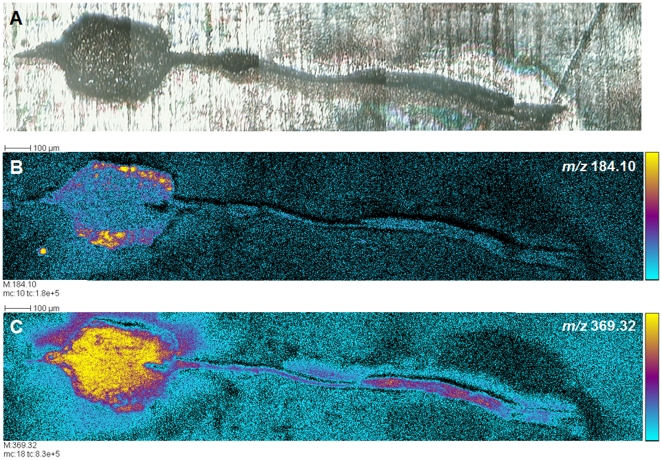
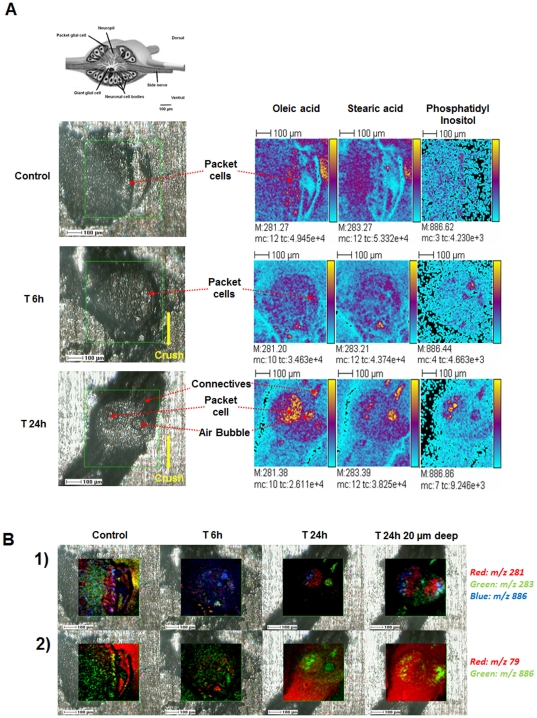
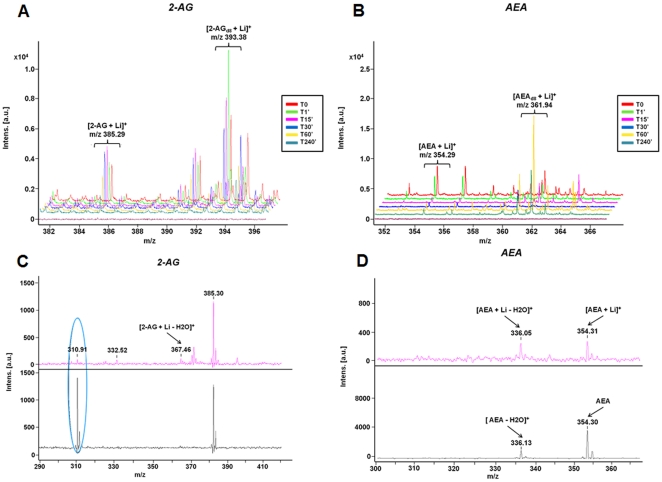
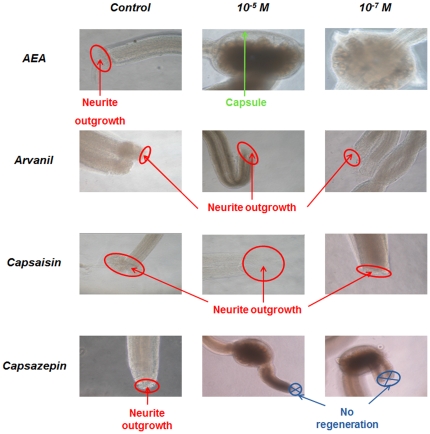
Results: Imaging mass spectrometry coupled to peptidomic and lipidomic methodologies allowed the selection of molecules whose spatiotemporal pattern of expression was of potential interest. The identification of peptides was aided by comparing MS/MS spectra obtained for the peptidome extracted from embryonic and adult tissues to leech transcriptome and genome databases. Through the parallel use of a classical lipidomic approach and secondary ion mass spectrometry, specific lipids, including cannabinoids, gangliosides and several other types, were detected in adult ganglia following mechanical damage to connected nerves. These observations motivated a search for possible effects of cannabinoids on neurite outgrowth. Exposing nervous tissues to Transient Receptor Potential Vanilloid (TRPV) receptor agonists resulted in enhanced neurite outgrowth from a cut nerve, while exposure to antagonists blocked such outgrowth.

Conclusion: The experiments on the regenerating adult leech CNS reported here provide direct evidence of increased titers of proteins that are thought to play important roles in early stages of neural development. Our data further suggest that endocannabinoids also play key roles in CNS regeneration, mediated through the activation of leech TRPVs, as a thorough search of leech genome databases failed to reveal any leech orthologs of the mammalian cannabinoid receptors but revealed putative TRPVs. In sum, our observations identify a number of lipids and proteins that may contribute to different aspects of the complex phenomenon of leech nerve regeneration, establishing an important base for future functional assays.


Conflict of interest statement

Competing Interests: The authors have declared that no competing interests exist.

Figures

Figure 1
Figure 1. MALDI-MSI analysis of peptides in sections of regenerating adult CNS.
A. Image of the dorsal aspect of a live adult specimen of a medicinal leech (Hirudo verbana), head up (left part). Drawing features the ventral nerve cord, from the head ganglion to the tail ganglion, including the 21 midbody ganglia (right part). The location of the connective nerve crush, anterior to midbody ganglion 9 (red scissors), and the nine cross-sections (panel C2) are indicated. Example of a live midbody ganglion in culture (insert on the right). The interganglionic connective nerves and the nerve roots are labeled . B. Two-dimensional representation of all the mass spectra (range m/z  = 1,000 to 30,000) corresponding to locations within a ganglion in the 9 sections (panel C2) shows variations in protein expression. The spectra are displayed as adjacent parallel lines in bands corresponding to each section (right of the graph). The number of pixels varies among sections, leading to bands of different widths. The spectra are normalized and ionic signal intensity is coded according to the color scale bar (0%: black to 100%: white) (left of the graph). (Section distribution for individual m/z values is diagrammed in Figure S4). C. (1) Full dendrogram shows the results of hierarchical clustering following principal component analysis of the MALDI-MSI dataset from 9 sections of the regenerating adult ganglion (panel B). The numbers in brackets correspond to the number of spectra per branch, and the horizontal numbers to the branch distances. (2) Reconstruction of selected dendrogram branches and corresponding images superposed on the 9 tissue sections, with each pixel color coded according to dendrogram branch. Only those pixels in the area of the ganglion are shown, superposed on the tissue image. Top row, sections 1-3, middle row, sections 4-6, bottom row, sections 7-9. Note that the number of pixels varies among sections.
Figure 2
Figure 2. Expression of the ion at m/z 2475 in both embryonic and regenerating adult CNS segmental ganglia.
A. Distribution of the m/z 2475 ion in a 12-day old leech embryo determined by MALDI-MSI of a dorsally-opened, whole mounted specimen. The ion is found at the highest abundance in the segmental ganglia of the ventral nerve cord. Head on the left, tail on the right, dorsal midline on the upper and lower margins of the dissected embryo. B. Distribution of the m/z 2475 ion in sections of the regenerating adult ganglion analyzed in Figure 1. The insert shows a magnified image of the data for section 4, with the abundance of the ion color coded according to the color bar at right. The peak corresponding to this ion is absent in a control adult (Figure S1), indicating a strong up-regulation of expression following injury.
Figure 3
Figure 3. Hierarchical clustering of spectra from 9 sections of a regenerating ganglion and surrounding blood sinus.
A. Drawing of the leech structure features the ventral blood sinus surrounding the nerve cord . B. Full dendrogram of all spectra in the ganglion dataset yields two main branches, colored red and green, that segregate into different domains in the images (panel C). C. Reconstruction of selected dendrogram branches and corresponding images shows that the upper branch (red) corresponds mainly with the blood cells (annulus around the central region) while the lower branch (green) corresponds mainly to cells in the CNS region. In some sections, however, cells characterized by the blood sinus peptide profile (red) appear to have migrated into the area of the ganglion (sections 5 and 6 in particular).
Figure 4
Figure 4. DD-RP-HPLC of leech axotomized nerve cords acidic extracts at different times after connective nerve trans-section.
After prepurification by solid phase extraction, the 60% AcN eluted material is loaded onto a C18 column. Elution is performed with a linear gradient of AcN (dotted line) and absorbance was monitored at 225 nm. Each individually collected peak is tested for its neurites outgrowth (example in upper left insert) and antimicrobial (example upper right insert) activities. The peaks that showed temporal variation in intensity, whether they produced antimicrobial or neurotrophic activity or not, are further purified and the peptides are identified by MALDI-TOF mass spectrometry and Edman degradation. Sequence results and peptide identification are shown in Table 2.
Figure 5
Figure 5. ToF-SIMS analysis of lipids in a portion of control leech nerve cord, including a ganglion.
A. Optical, transmitted light low-resolution image of unstained tissue (ganglion and parts of attached nerve) prior to ToF-SIMS analyses. The ganglion is placed in gelatin before being sectioned at 10 µm. The slices are deposited onto silicium target. B, C. Tissue distributions of two ions, m/z 184.1 and m/z 369.32, corresponding to the phosphocholine ion and to the cholesterol fragment ion [M+H-H2O]+, respectively. The phosphocholine ion can be observed mainly in the outer areas of the ganglion, where neuronal somata and glial packets are located, while the cholesterol fragment ion is also found throughout the central neuropil. Five adjacent individual images of 500×500 µm2 where assembled end-to-end to create these images. Color scale bars, with amplitude in number of counts, are indicated to the right of each ion image. The amplitude of the color scale corresponds to the maximum number of counts mc and could be read as [0, mc]. tc is the total number of counts recorded for the specified m/z (sum of counts in all the pixels).
Figure 6
Figure 6. ToF-SIMS lipid ion images of leech ganglia in course of regeneration.
A. Drawing of the structure of ganglion (upper left of the panel) . Optical, transmitted light low-resolution images of control, 6 h and 24 h regeneration ganglia included into gelatin 10% before sectioning (lower left of the panel). Highlighting the changing distributions of oleic acid carboxylate (m/z 281.2), stearic acid carboxylate (m/z 283.2) and phosphatidylinositol PI34:2 (m/z 885.5) in these ganglia in course of regeneration by ToF-SIMS imaging (right of the panel). Color scale bars, with amplitude in number of counts, are indicated on the right margin of each ion image. The amplitude of the color scale corresponds to the maximum number of counts mc and could be read as [0, mc]. tc is the total number of counts recorded for the specified m/z (sum of counts in all the pixels). B. Lipid ion images (color overlays) of leech ganglion in course of regeneration (0:control, 6 h and 24 h regeneration). (1) Oleic acid carboxylate (m/z 281.2), stearic acid (m/z 283.2) and phosphatidylinositol PI34:2 (m/z 885.5) and (2) Phosphatidylinositol (m/z 885.5) and phostate (m/z 78.9).
Figure 7
Figure 7. Levels of cannabinoids change as a function of time after injury.
Time course MALDI-TOF measurement of cannabinoids in injured nerve cords from time 0 to time 240 minutes. A. Levels of 2-AG and 2-AG deuterated (D2O) with lithium chloride addition after the nerve cord lesions. B. Levels of AEA and AEA deuterated (D20) with lithium chloride addition after nerve cord crush. C. MALDI-MS spectra of standards of 2-AG and 2-AG with lithium chloride addition. D. MALDI-MS spectra of standards of AEA and AEA with lithium chloride addition.
Figure 8
Figure 8. Cannabinoids affect neurite outgrowth from cut nerves in cultured segments of the CNS.
In vitro leech nerve cord culture and neurite outgrowth assays with arvanil, capsaicin, capsazepin at concentration of 10−5M or 10−7M. Neurite outgrowth is indicated as well as the ones non regenerating.
Figure 9
Figure 9. Phylogenetic tree showing Hirudo, Helobdella, mouse, rat, Human TRPVs and C. elegans, D. melanogaster OSMs.
Leech TRPVs are slightly less diverged from mammalian TRPVs than those of C. elegans and drosophila and are closest to mammalian TRPV5 and TRPV6. (ce, Caenorhabditis elegans; dm, Drosophila melanogaster; hm, Hirudo medicinalis; hr, Helobdella robusta; hs, Homo sapiens; mm, Mus musculus; rn, Rattus norvegicus).

Similar articles

Cited by

References

    1. Nicholls JG, Hernandez UG. Growth and synapse formation by identified leech neurones in culture: a review. Q J Exp Physiol. 1989;74:965–973. - PubMed
    1. Deriemer SA, Elliott EJ, Macagno ER, Muller KJ. Morphological evidence that regenerating axons can fuse with severed axon segments. Brain Res. 1983;272:157–161. - PubMed
    1. Blackshaw SE, Babington EJ, Emes RD, Malek J, Wang WZ. Identifying genes for neuron survival and axon outgrowth in Hirudo medicinalis. J Anat. 2004;204:13–24. - PMC - PubMed
    1. Emes RD, Wang WZ, Lanary K, Blackshaw SE. HmCRIP, a cysteine-rich intestinal protein, is expressed by an identified regenerating nerve cell. FEBS Lett. 2003;533:124–128. - PubMed
    1. Korneev S, Fedorov A, Collins R, Blackshaw SE, Davies JA. A subtractive cDNA library from an identified regenerating neuron is enriched in sequences up-regulated during nerve regeneration. Invert Neurosci. 1997;3:185–192. - PubMed

Publication types

MeSH terms