. 2011 Apr 28:4:10.
doi: 10.1186/1756-0381-4-10.

Using graph theory to analyze biological networks

Affiliations

Using graph theory to analyze biological networks

Georgios A Pavlopoulos et al. BioData Min. .

Abstract

Understanding complex systems often requires a bottom-up analysis towards a systems biology approach. The need to investigate a system, not only as individual components but as a whole, emerges. This can be done by examining the elementary constituents individually and then how these are connected. The myriad components of a system and their interactions are best characterized as networks and they are mainly represented as graphs where thousands of nodes are connected with thousands of vertices. In this article we demonstrate approaches, models and methods from the graph theory universe and we discuss ways in which they can be used to reveal hidden properties and features of a network. This network profiling combined with knowledge extraction will help us to better understand the biological significance of the system.


Figures

Figure 1
Figure 1
Undirected, Directed, Weighted, Bipartite graphs. A. Undirected Graph: V = {V1, V2, V3, V4}, |V| = 4, E = {(V1, V2), (V2, V3), (V2, V4), (V4, V1)}, |E| = 4. B. Directed Graph: V = {V1, V2, V3, V4}, |V| = 4, E = {(V1, V2), (V2, V3), (V2, V4), (V4, V1), (V4, V2)}, |E| = 5. C. Weighted Graph: V = {V1, V2, V3, V4}, |V| = 4, E = {(V1, V2, V4), (V2, V3, V2), (V2, V4, V9), (V4, V1, V8), (V4, V2, V6)}, |E| = 5. D. Bipartite graph: V = {U1, U2, U3, U4, V1, V2, V3}, |V| = 7, E = {(U1, V1), (U2, V1), (U2, V2), (U2, V3), (U3, V2), (U4, V2)}, |E| = 6.
Figure 2
Figure 2
Data structures. A. A Directed Graph: A random graph consisting of five nodes and six directed edges. B. Adjacency List: The data structure which represents the directed graph using lists. C. Adjacency Matrix: The data structure which represents the directed graph using a 2D matrix. The zeros represent the absence of the connection whereas the ones represent the existence of the connection between two nodes. The matrix is not symmetric since the graph is directed.
Figure 3
Figure 3
Graph Isomorphism. V = {V1, V2, V3, V4}, |V| = 4, E = {(V1, V2), (V1, V3), (V1, V4), (V2, V3), (V2, V4), (V3, V4)}, |E| = 6. Graphs A and B have different topology but they are isomorphs. The graph is fully connected and every node is connected to any other so that it forms a fully connected clique.
Figure 4
Figure 4
Walks, simple paths trails and cycles in graphs. A walk is a sequence of nodes e.g. (V2, V3, V6, V5, V3). A simple path is a walk with no repeated nodes, e.g. (V1, V4, V5, V2, V3). A trail is a walk where no edges are repeated e.g. (V1, V2, V3 V6). A cycle is a walk (V1, V2,..., VL) where V1 = VL with no other nodes repeated and L>3, e.g. (V1, V2, V5, V4, V1).
Figure 5
Figure 5
Clustering Coefficient. A) Node V behaves like a hub but it has clustering coefficient C = 0. B) Node V comes with a high clustering coefficient. The maximum number of potential connection is given by Emax=|V|(|V|-1)/2 where |V| = 5 is the number of the neighbors of node V, thus Emax = 10. The neighbors of node V are connected with 7 edges between each other, E = {(V1, V2), (V2, V3), (V3, V4), (V4, V5), (V5, V1), (V1, V3), (V1, V4)}. The clustering coefficient of node V is C = EV/Emax = 7/10 = 0.7.
Figure 6
Figure 6
Network Motifs. Some common network motifs. A) Feed-forward loop. Type of networks: protein, neuron, electronic. B) Three chain. Type of network: food webs. C) Four node feedback. Type of network: gene regulatory, electronic. D) Three node feedback. Type of network: gene regulatory, electronic. E) Bi-parallel. Type of network: gene regulatory, biochemical. F) Bi-Fan. Type of networks: protein, neuron, electronic [74].
Figure 7
Figure 7
Closeness and Betweeness centralities. Closeness centrality. V1: d1 = 4 × 1 + 1 × 2 + 1 × 3 = 9, Cclo(1) = 6/9. V1 accesses 4 nodes (V2, V5, V6, V7) with step 1, 1 node (V3) with step 2 and 1 node (V4) with step 3. 6 nodes can be accessed in total by V1. V2: d2 = 2 × 1 + 4 × 2 = 10 > d1, Cclo(2) = 6/10. V2 accesses 2 nodes (V1, V3) with step 1 and 4 nodes (V4, V5, V6, V7) with step 2. 6 nodes can also be accessed in total by V2. As a result, V1 is more central than node V2 since d1>d2. Betweenness centrality. Np(1) = 12 shortest paths that pass through node V1. The paths from the starting to the ending node are {V2-V5, V2-V6, V2-V7, V3-V5, V3-V6, V3-V7, V4-V5, V4-V6, V4-V7, V5-V6, V5-V7, V6-V7}. Np(2) = 8 shortest paths that pass through node V2. The paths are {V1-V3, V1-V4, V3-V5, V3-V6, V3-V7, V4-V5, V4-V6, V4-V7}. Np(3) = 5 {V1-V4, V2-V4, V4-V5, V4-V6, V4-V7}. Np(4) = Np(5) = Np(6) = Np(7) = 0. Np = 25 the total sum of shortest paths that pass through the nodes, thus Np= Np(1)+Np(2)+Np(3)+Np(4)+Np(5)+Np(6)+Np(7). The centralities are Cb (1) = 12/25 = 0.48, Cb (2) = 8/25 = 0.32, Cb (3) = 5/25 = 0.20, Cb (4) = Cb (5) = Cb (6) = Cb (7) = 0, thus node V1 is more central.
Figure 8
Figure 8
Eccentricity Centrality. V1: 4 × 1, 2 × 2; V1 accesses 4 nodes (V2, V3, V5, V6) with step 1 and 2 nodes (V4, V7) with step 2. The step represents the shortest path. The maximum shortest path dmax = 2. V2: 3 × 1, 3 × 2; Similarly V2 accesses 3 nodes (V4, V7, V1) with step 1 and 3 nodes (V3, V5, V6) with step 2. The maximum shortest path dmax = 2. V3: 2 × 1, 3 × 2, 1 × 3; Similarly V3 accesses 2 nodes (V1, V4) with step 1, 3 nodes (V2, V5, V6) and one node (V7) with step 3. The maximum shortest path dmax = 3. V4: 2 × 1, 2 × 2, 2 × 3; The maximum shortest path dmax=3. V5: 1 × 1, 3 × 2, 2 × 3; The maximum shortest path dmax = 3. V6: 1 × 1, 3 × 2, 2 × 3; The maximum shortest path dmax = 3. V7: 1 × 1, 2 × 2, 3 × 3; The maximum shortest path dmax = 3. As a result, the ordering of the nodes according to Cecc : (V1,V2), (V3,V4,V5,V6,V7).
Figure 9
Figure 9
Matching Index. V1 is connected with 5 nodes (V3, V4, V6, V7,V8). V2 is connected with 4 nodes (V3, V4, V5, V8). V3 is connected with 2 nodes (V1, V2). V4 is connected with 3 nodes (V1, V2). V5 is connected with 1 node (V2). V6 is connected with 1 node (V1). V7 is connected with 1 node (V1). V8 is connected with 2 nodes (V1, V5). Node V1 and V2 are connected with 3 common nodes (V3, V4, V8)and in total with 6 distinct neighbors (V3, V4, V8, V5, V6 , V7). The matching index will then be M1,2 = 3/6 = 0.5, thus V1 and V2 are functionally similar even though they are not connected.
Figure 10
Figure 10
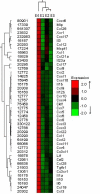
Average linkage hierarchical clustering example. The expression of 44 genes was measured in 4 experiments (E1, E2, E3, E4). The genes were classified according to their coexpression levels. The Pearson Correlation Coefficient was used (r-value) to analyze gene set signal values. Genes were clustered according to the r-value correlation matrix using the Average Linkage Hierarchical clustering method. The tree on the left clusters the expressions of the genes whereas the tree on top of the figure clusters the profiles of the experiments. Thus experiments E2 and E3 are similar and closely related.
Figure 11
Figure 11
Predicting protein complexes from PPI networks. Protein complexes predicted after applying Spectral clustering algorithm and filtering the results in a yeast protein-protein dataset [12] using the jClust application [146]. The budding yeast Arp2/3 complex that is highlighted was successfully predicted.

References

    1. Pellegrini Matteo, Haynor David, Johnson JM. Protein interaction networks. Expert Rev Proteomics. 2004;1(2) - PubMed
    1. Vikis HG, Guan KL. Glutathione-S-transferase-fusion based assays for studying protein-protein interactions. Methods Mol Biol. 2004;261:175–186. - PubMed
    1. Puig O, Caspary F, Rigaut G, Rutz B, Bouveret E, Bragado-Nilsson E, Wilm M, Seraphin B. The tandem affinity purification (TAP) method: a general procedure of protein complex purification. Methods. 2001;24(3):218–229. - PubMed
    1. Ito T, Chiba T, Ozawa R, Yoshida M, Hattori M, Sakaki Y. A comprehensive two-hybrid analysis to explore the yeast protein interactome. Proc Natl Acad Sci USA. 2001;98(8):4569–4574. - PMC - PubMed
    1. Gavin AC, Bosche M, Krause R, Grandi P, Marzioch M, Bauer A, Schultz J, Rick JM, Michon AM, Cruciat CM. et al. Functional organization of the yeast proteome by systematic analysis of protein complexes. Nature. 2002;415(6868):141–147. - PubMed

LinkOut - more resources