

Regulatory hotspots are associated with plant gene expression under varying soil phosphorus supply in Brassica rapa
- PMID: 21527424
- PMCID: PMC3135916
- DOI: 10.1104/pp.111.175612
Regulatory hotspots are associated with plant gene expression under varying soil phosphorus supply in Brassica rapa
Abstract
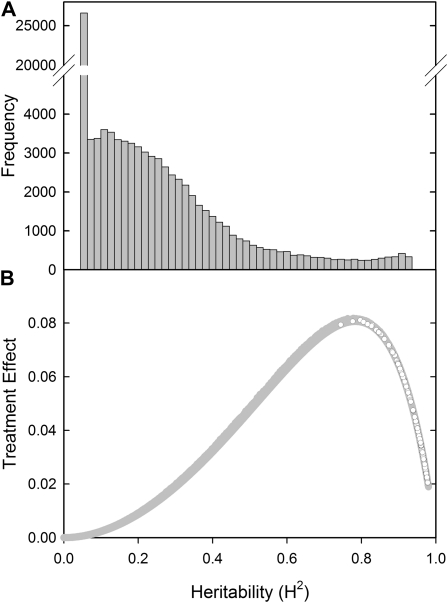
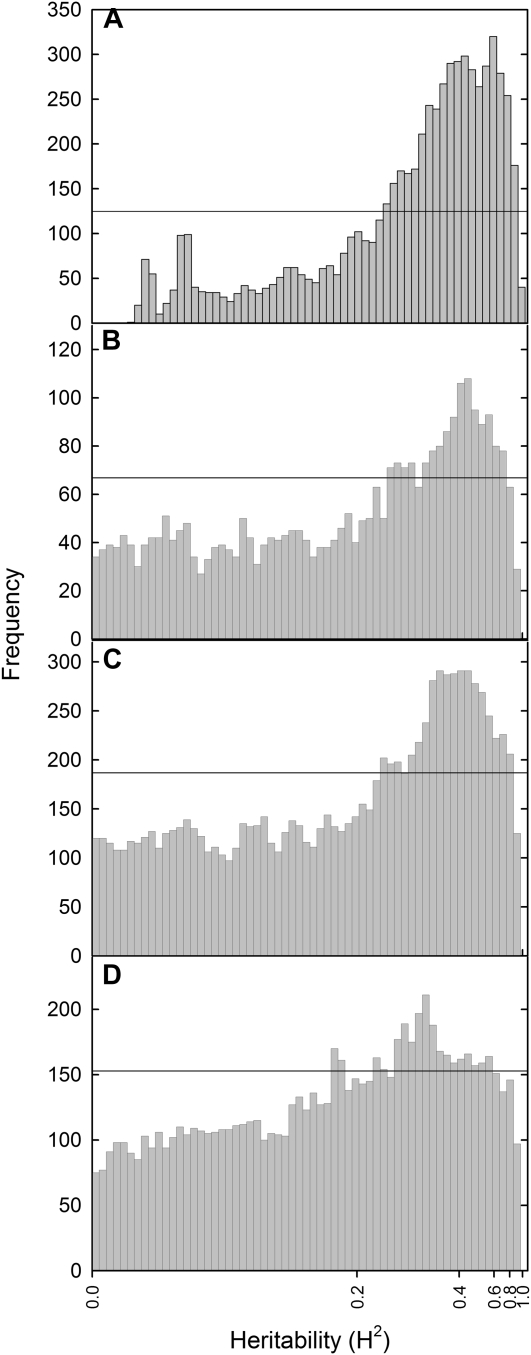
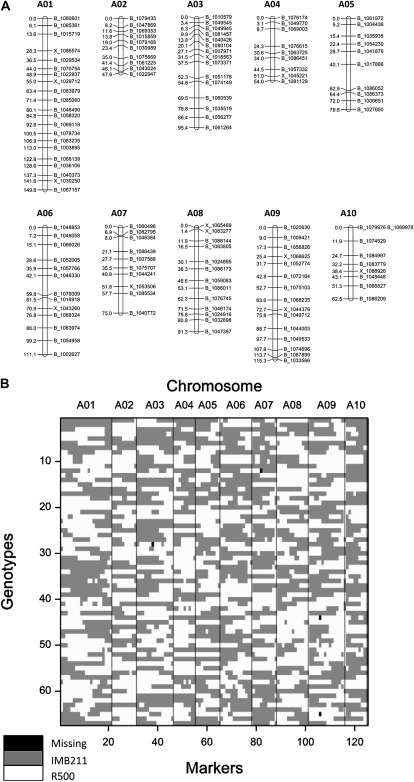
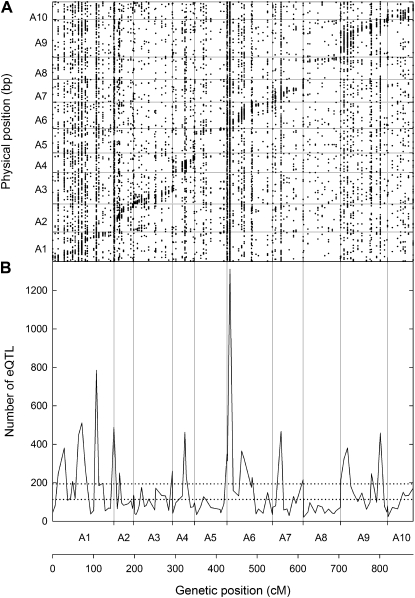
Gene expression is a quantitative trait that can be mapped genetically in structured populations to identify expression quantitative trait loci (eQTL). Genes and regulatory networks underlying complex traits can subsequently be inferred. Using a recently released genome sequence, we have defined cis- and trans-eQTL and their environmental response to low phosphorus (P) availability within a complex plant genome and found hotspots of trans-eQTL within the genome. Interval mapping, using P supply as a covariate, revealed 18,876 eQTL. trans-eQTL hotspots occurred on chromosomes A06 and A01 within Brassica rapa; these were enriched with P metabolism-related Gene Ontology terms (A06) as well as chloroplast- and photosynthesis-related terms (A01). We have also attributed heritability components to measures of gene expression across environments, allowing the identification of novel gene expression markers and gene expression changes associated with low P availability. Informative gene expression markers were used to map eQTL and P use efficiency-related QTL. Genes responsive to P supply had large environmental and heritable variance components. Regulatory loci and genes associated with P use efficiency identified through eQTL analysis are potential targets for further characterization and may have potential for crop improvement.
Figures
Similar articles
-
Integrating transcriptomic network reconstruction and eQTL analyses reveals mechanistic connections between genomic architecture and Brassica rapa development.PLoS Genet. 2019 Sep 12;15(9):e1008367. doi: 10.1371/journal.pgen.1008367. eCollection 2019 Sep. PLoS Genet. 2019. PMID: 31513571 Free PMC article.
-
Identification and validation of genomic regions for pod shatter resistance in Brassica rapa using QTL-seq and traditional QTL mapping.BMC Plant Biol. 2025 Feb 10;25(1):175. doi: 10.1186/s12870-025-06155-z. BMC Plant Biol. 2025. PMID: 39930375 Free PMC article.
-
The Brassica rapa FLC homologue FLC2 is a key regulator of flowering time, identified through transcriptional co-expression networks.J Exp Bot. 2013 Nov;64(14):4503-16. doi: 10.1093/jxb/ert264. Epub 2013 Sep 27. J Exp Bot. 2013. PMID: 24078668 Free PMC article.
-
Mapping quantitative trait loci for tissue culture response in VCS3M-DH population of Brassica rapa.Plant Cell Rep. 2013 Aug;32(8):1251-61. doi: 10.1007/s00299-013-1433-2. Epub 2013 Apr 6. Plant Cell Rep. 2013. PMID: 23563522
-
A Systems Genetics Approach Identifies Gene Regulatory Networks Associated with Fatty Acid Composition in Brassica rapa Seed.Plant Physiol. 2016 Jan;170(1):568-85. doi: 10.1104/pp.15.00853. Epub 2015 Oct 30. Plant Physiol. 2016. PMID: 26518343 Free PMC article.
Cited by
-
Early Responses of Brassica oleracea Roots to Zinc Supply Under Sufficient and Sub-Optimal Phosphorus Supply.Front Plant Sci. 2020 Jan 9;10:1645. doi: 10.3389/fpls.2019.01645. eCollection 2019. Front Plant Sci. 2020. PMID: 31998335 Free PMC article.
-
Genetical and comparative genomics of Brassica under altered Ca supply identifies Arabidopsis Ca-transporter orthologs.Plant Cell. 2014 Jul;26(7):2818-30. doi: 10.1105/tpc.114.128603. Epub 2014 Jul 31. Plant Cell. 2014. PMID: 25082855 Free PMC article.
-
Envirotyping for deciphering environmental impacts on crop plants.Theor Appl Genet. 2016 Apr;129(4):653-673. doi: 10.1007/s00122-016-2691-5. Epub 2016 Mar 1. Theor Appl Genet. 2016. PMID: 26932121 Free PMC article. Review.
-
Using RNA-Seq for Genomic Scaffold Placement, Correcting Assemblies, and Genetic Map Creation in a Common Brassica rapa Mapping Population.G3 (Bethesda). 2017 Jul 5;7(7):2259-2270. doi: 10.1534/g3.117.043000. G3 (Bethesda). 2017. PMID: 28546385 Free PMC article.
-
High-throughput root phenotyping screens identify genetic loci associated with root architectural traits in Brassica napus under contrasting phosphate availabilities.Ann Bot. 2013 Jul;112(2):381-9. doi: 10.1093/aob/mcs245. Epub 2012 Nov 21. Ann Bot. 2013. PMID: 23172414 Free PMC article.
References
-
- Andersson MX, Larsson KE, Tjellström H, Liljenberg C, Sandelius AS. (2005) Phosphate-limited oat: the plasma membrane and the tonoplast as major targets for phospholipid-to-glycolipid replacement and stimulation of phospholipases in the plasma membrane. J Biol Chem 280: 27578–27586 - PubMed
-
- Andersson MX, Stridh MH, Larsson KE, Liljenberg C, Sandelius AS. (2003) Phosphate-deficient oat replaces a major portion of the plasma membrane phospholipids with the galactolipid digalactosyldiacylglycerol. FEBS Lett 537: 128–132 - PubMed
-
- Benjamini Y, Hochberg Y. (1995) Controlling the false discovery rate: a practical and powerful approach to multiple testing. J R Stat Soc Ser B Stat Methodol 57: 289–300
-
- Bentsink L, Yuan K, Koornneef M, Vreugdenhil D. (2003) The genetics of phytate and phosphate accumulation in seeds and leaves of Arabidopsis thaliana, using natural variation. Theor Appl Genet 106: 1234–1243 - PubMed
Publication types
MeSH terms
Substances
Grants and funding
- BB/G013969/1/BB_/Biotechnology and Biological Sciences Research Council/United Kingdom
- BBG013969/BB_/Biotechnology and Biological Sciences Research Council/United Kingdom
- BBE017797/BB_/Biotechnology and Biological Sciences Research Council/United Kingdom
- BB/G015716/1/BB_/Biotechnology and Biological Sciences Research Council/United Kingdom
- BB/G014159/1/BB_/Biotechnology and Biological Sciences Research Council/United Kingdom
LinkOut - more resources
Full Text Sources
Molecular Biology Databases
