. 2011 Jun 23;117(25):6876-84.
doi: 10.1182/blood-2010-11-314393. Epub 2011 Apr 28.

SNP array-based karyotyping: differences and similarities between aplastic anemia and hypocellular myelodysplastic syndromes

Affiliations

SNP array-based karyotyping: differences and similarities between aplastic anemia and hypocellular myelodysplastic syndromes

Manuel G Afable 2nd et al. Blood. .

Abstract

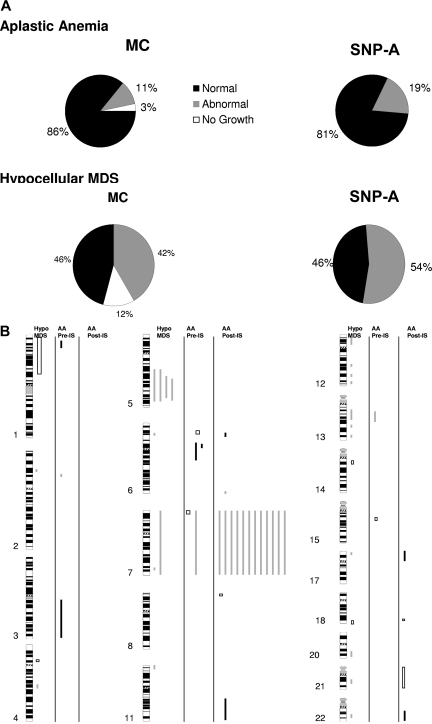
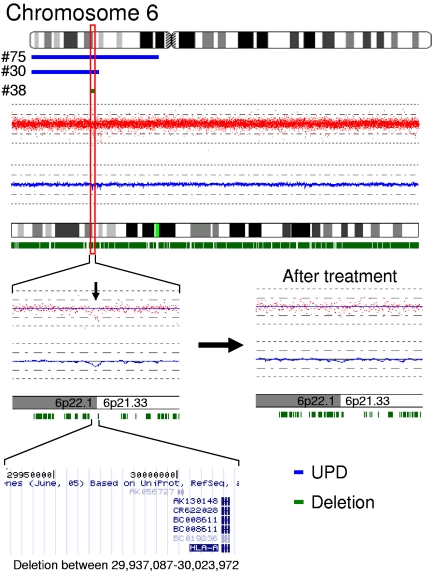
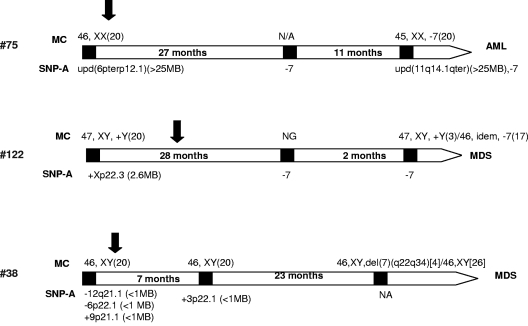
In aplastic anemia (AA), contraction of the stem cell pool may result in oligoclonality, while in myelodysplastic syndromes (MDS) a single hematopoietic clone often characterized by chromosomal aberrations expands and outcompetes normal stem cells. We analyzed patients with AA (N = 93) and hypocellular MDS (hMDS, N = 24) using single nucleotide polymorphism arrays (SNP-A) complementing routine cytogenetics. We hypothesized that clinically important cryptic clonal aberrations may exist in some patients with BM failure. Combined metaphase and SNP-A karyotyping improved detection of chromosomal lesions: 19% and 54% of AA and hMDS cases harbored clonal abnormalities including copy-neutral loss of heterozygosity (UPD, 7%). Remarkably, lesions involving the HLA locus suggestive of clonal immune escape were found in 3 of 93 patients with AA. In hMDS, additional clonal lesions were detected in 5 (36%) of 14 patients with normal/noninformative routine cytogenetics. In a subset of AA patients studied at presentation, persistent chromosomal genomic lesions were found in 10 of 33, suggesting that the initial diagnosis may have been hMDS. Similarly, using SNP-A, earlier clonal evolution was found in 4 of 7 AA patients followed serially. In sum, our results indicate that SNP-A identify cryptic clonal genomic aberrations in AA and hMDS leading to improved distinction of these disease entities.


Figures

Figure 1
Figure 1
Detection of somatic genomic loss in BM failure syndromes using SNP-A analysis. (A) At the top, a whole-genome view is shown for patient 57. Individual dots represent the raw signal intensity of a specific SNP, which indicates the copy number at that locus. In general, the copy number is around 2N. Each chromosome is represented by a different color, from chromosome 1 on the left to the X chromosome on the right. Loss of chromosome 7, as well as the “physiologic” loss of the X chromosome in this male patient can be seen. At a higher level of resolution, the total and allele-specific copy numbers can be investigated for individual chromosomes. In the middle, Affymetrix 250K array karyograms for chromosomes 7 and X are displayed. The blue line represents smoothed total copy number, while the green ticks below the ideogram represent heterozygous calls. Although both chromosomes 7 and X show a reduced copy number, indicating loss of the entire chromosome, the presence of a large number of heterozygous calls along the length of chromosome 7 is consistent with the clonal nature of this lesion, compared with the X chromosome which has almost no heterozygous calls. Those that remain most likely reflect technical artifacts. At the bottom, karyograms from Affymetrix 6.0 array analysis of the same patient are shown. Raw and smoothed copy number tracks, as well as allele calls (blue dots), are shown. A reduction in the total copy number, as well as loss of heterozygous calls, are seen for both chromosomes, indicative of deletion. (B) Large clonal lesions were detectable in patients with AA by SNP-A. The results are shown for an exemplary patient (no. 96). On the short arm of chromosome 6, loss of heterozygous calls (heterozygous SNP call and allele-specific copy number tracks) with a normal diploid copy number marked a region of copy-neutral loss of heterozygosity in the somatic (BM) but not germline (CD3+) configuration. Similarly, clonal monosomy 7 was identified in this patient.
Figure 2
Figure 2
Frequency and genomic distribution of lesions detected by SNP-A. (A) Metaphase karyotyping identified lesions in a subset of patients with AA (top left); however, 3% of the patients had noninformative MC because of failure of growth. When MC and SNP-A karyotyping were combined, the detection rate for chromosomal lesions was increased (top right). In addition, the noninformative cases were resolved. For hMDS, when MC and SNP-A karyotyping were combined, the detection rate for was increased from 42% to 54% (bottom). (B) Genomic distribution of lesions detected by SNP-A in the analyses of hMDS and AA. □ and illustrate genomic gains and losses, respectively. ■ depicts regions of segmental UPD.
Figure 3
Figure 3
SNP-A identifies genomic regions with potential pathogenic significance in AA. We identified 2 overlapping regions of copy-neutral loss of heterozygosity (blue bars) on the short arm of chromosome 6 in patients with AA; a microdeletion at 6p22.1 (86 KB, green bar) in a third patient defined a minimally affected region (top). This region contained the HLA-A locus. The patient with the microdeletion (no. 48) was treated with immunosuppression. After immunosuppression, the lesion disappeared, confirming the somatic nature of the lesion.
Figure 4
Figure 4
Behavior of SNP-A characterized lesions through the clinical course. Using SNP-A–based karyotyping, clonal monosomy 7 was identified earlier in some patients in our cohort (nos. 122, 75, 38). In addition, SNP-A analysis identified clonal lesions in a patient (no. 38) before immunosuppression that disappeared posttreatment. Number 75 had normal cytogenetics by MC at presentation but SNP-A analysis revealed a uniparental disomy (UPD). Black squares indicate clinical time points where karyotyping was performed using SNP-A and/or metaphase cytogenetics. The metaphase karyotype is given above and the SNP-A-based karyotype below the bars representing the clinical course. NG indicates no growth of the metaphase culture; and NA, result not available. Black arrows indicate when immunosuppression was initiated. The time given in months indicates the length of time between karyotype timepoints.

References

    1. Mufti GJ. Chromosomal deletions in the myelodysplastic syndrome. Leuk Res. 1992;16(1):35–41. - PubMed
    1. Fenaux P. Chromosome and molecular abnormalities in myelodysplastic syndromes. Int J Hematol. 2001;73(4):429–437. - PubMed
    1. Barrett J, Saunthararajah Y, Molldrem J. Myelodysplastic syndrome and aplastic anemia: distinct entities or diseases linked by a common pathophysiology? Semin Hematol. 2000;37(1):15–29. - PubMed
    1. Toyama K, Ohyashiki K, Yoshida Y, et al. Clinical and cytogenetic findings of myelodysplastic syndromes showing hypocellular bone marrow or minimal dysplasia, in comparison with typical myelodysplastic syndromes. Int J Hematol. 1993;58(1–2):53–61. - PubMed
    1. Maciejewski JP, Risitano A, Sloand EM, Nunez O, Young NS. Distinct clinical outcomes for cytogenetic abnormalities evolving from aplastic anemia. Blood. 2002;99(9):3129–3135. - PubMed

Publication types