Unrepaired clustered DNA lesions induce chromosome breakage in human cells
- PMID: 21527720
- PMCID: PMC3100920
- DOI: 10.1073/pnas.1016045108
Unrepaired clustered DNA lesions induce chromosome breakage in human cells
Abstract
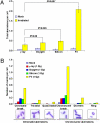
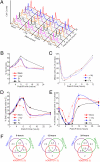
Clustered DNA damage induced by ionizing radiation is refractory to repair and may trigger carcinogenic events for reasons that are not well understood. Here, we used an in situ method to directly monitor induction and repair of clustered DNA lesions in individual cells. We showed, consistent with biophysical modeling, that the kinetics of loss of clustered DNA lesions was substantially compromised in human fibroblasts. The unique spatial distribution of different types of DNA lesions within the clustered damages, but not the physical location of these damages within the subnuclear domains, determined the cellular ability to repair the damage. We then examined checkpoint arrest mechanisms and yield of gross chromosomal aberrations. Induction of nonrepairable clustered damage affected only G2 accumulation but not the early G2/M checkpoint. Further, cells that were released from the G2/M checkpoint with unrepaired clustered damage manifested a spectrum of chromosome aberrations in mitosis. Difficulties associated with clustered DNA damage repair and checkpoint release before the completion of clustered DNA damage repair appear to promote genome instability that may lead to carcinogenesis.
Conflict of interest statement
The authors declare no conflict of interest.
Figures


Similar articles
-
Fanconi anemia cells with unrepaired DNA damage activate components of the checkpoint recovery process.Theor Biol Med Model. 2015 Sep 18;12:19. doi: 10.1186/s12976-015-0011-4. Theor Biol Med Model. 2015. PMID: 26385365 Free PMC article.
-
Checkpoint abrogation in G2 compromises repair of chromosomal breaks in ataxia telangiectasia cells.Cancer Res. 2005 Dec 15;65(24):11292-6. doi: 10.1158/0008-5472.CAN-05-2148. Cancer Res. 2005. PMID: 16357135
-
Defective expression of the DNA mismatch repair protein, MLH1, alters G2-M cell cycle checkpoint arrest following ionizing radiation.Cancer Res. 1998 Feb 15;58(4):767-78. Cancer Res. 1998. PMID: 9485033
-
Cell cycle checkpoints and DNA repair preserve the stability of the human genome.Cancer Metastasis Rev. 1995 Mar;14(1):31-41. doi: 10.1007/BF00690209. Cancer Metastasis Rev. 1995. PMID: 7606819 Review.
-
Radiation-induced clustered DNA lesions: Repair and mutagenesis.Free Radic Biol Med. 2017 Jun;107:125-135. doi: 10.1016/j.freeradbiomed.2016.12.008. Epub 2016 Dec 8. Free Radic Biol Med. 2017. PMID: 27939934 Review.
Cited by
-
Dysfunctional telomeres trigger cellular senescence mediated by cyclic GMP-AMP synthase.J Biol Chem. 2020 Aug 7;295(32):11144-11160. doi: 10.1074/jbc.RA120.012962. Epub 2020 Jun 15. J Biol Chem. 2020. PMID: 32540968 Free PMC article.
-
Bcl2 inhibits recruitment of Mre11 complex to DNA double-strand breaks in response to high-linear energy transfer radiation.Nucleic Acids Res. 2015 Jan;43(2):960-72. doi: 10.1093/nar/gku1358. Epub 2015 Jan 7. Nucleic Acids Res. 2015. PMID: 25567982 Free PMC article.
-
Carbon Ion Radiobiology.Cancers (Basel). 2020 Oct 17;12(10):3022. doi: 10.3390/cancers12103022. Cancers (Basel). 2020. PMID: 33080914 Free PMC article. Review.
-
Exploring the LET dependence of DNA DSB repair kinetics using the DR DNA database.J Radiat Res. 2024 Sep 24;65(5):651-657. doi: 10.1093/jrr/rrae071. J Radiat Res. 2024. PMID: 39278665 Free PMC article.
-
Radiobiological effects of the alpha emitter Ra-223 on tumor cells.Sci Rep. 2019 Dec 6;9(1):18489. doi: 10.1038/s41598-019-54884-7. Sci Rep. 2019. PMID: 31811257 Free PMC article.
References
-
- Nikjoo H, O'Neill P, Wilson WE, Goodhead DT. Computational approach for determining the spectrum of DNA damage induced by ionizing radiation. Radiat Res. 2001;156:577–583. - PubMed
-
- Goodhead DT. Initial events in the cellular effects of ionizing radiations: Clustered damage in DNA. Int J Radiat Biol. 1994;65:7–17. - PubMed
-
- Ward JF. DNA damage produced by ionizing radiation in mammalian cells: identities, mechanisms of formation, and reparability. Prog Nucleic Acid Res Mol Biol. 1988;35:95–125. - PubMed
-
- Brenner DJ, Ward JF. Constraints on energy deposition and target size of multiply damaged sites associated with DNA double-strand breaks. Int J Radiat Biol. 1992;61:737–748. - PubMed
-
- Blaisdell JO, Harrison L, Wallace SS. Base excision repair processing of radiation-induced clustered DNA lesions. Radiat Prot Dosimetry. 2001;97:25–31. - PubMed
Publication types
MeSH terms
Grants and funding
LinkOut - more resources
Full Text Sources
Other Literature Sources

