

Prediction of motor recovery using initial impairment and fMRI 48 h poststroke
- PMID: 21527788
- PMCID: PMC3209795
- DOI: 10.1093/cercor/bhr047
Prediction of motor recovery using initial impairment and fMRI 48 h poststroke
Abstract
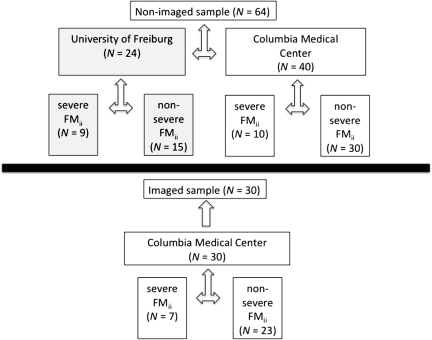
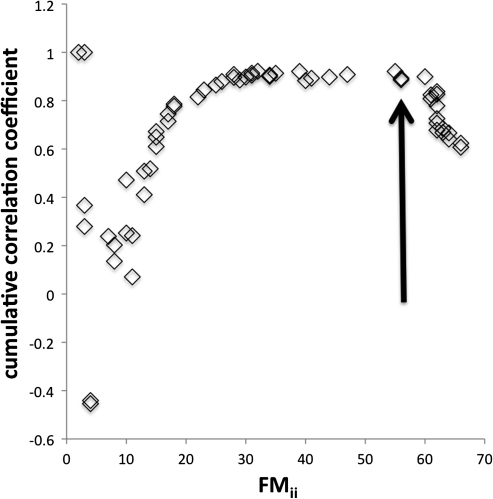
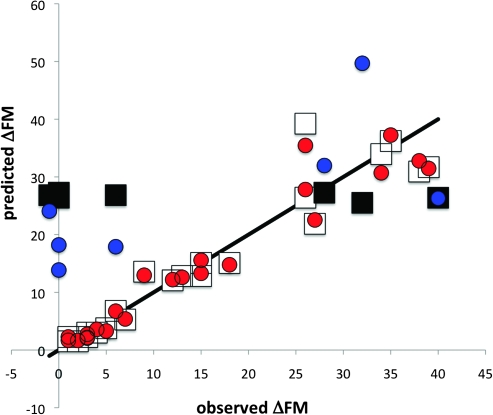
There is substantial interpatient variation in recovery from upper limb impairment after stroke in patients with severe initial impairment. Defining recovery as a change in the upper limb Fugl-Meyer score (ΔFM), we predicted ΔFM with its conditional expectation (i.e., posterior mean) given upper limb Fugl-Meyer initial impairment (FM(ii)) and a putative functional magnetic resonance imaging (fMRI) recovery measure. Patients with first time, ischemic stroke were imaged at 2.5 ± 2.2 days poststroke with 1.5-T fMRI during a hand closure task alternating with rest (fundamental frequency = 0.025 Hz, scan duration = 172 s). Confirming a previous finding, we observed that the prediction of ΔFM by FM(ii) alone is good in patients with nonsevere initial hemiparesis but is not good in patients with severe initial hemiparesis (96% and 16% of the total sum of squares of ΔFM explained, respectively). In patients with severe initial hemiparesis, prediction of ΔFM by the combination of FM(ii) and the putative fMRI recovery measure nonsignificantly increased predictive explanation from 16% to 47% of the total sum of squares of ΔFM explained. The implications of this preliminary negative result are discussed.
Figures
References
-
- Akaike H. New look at statistical-model identification. IEEE Trans Automat Contr. 1974;Ac19:716–723.
-
- Binkofski F, Seitz RJ, Hacklander T, Pawelec D, Mau J, Freund HJ. Recovery of motor functions following hemiparetic stroke: a clinical and magnetic resonance-morphometric study. Cerebrovasc Dis. 2001;11:273–281. - PubMed
-
- Burnham KP, Anderson DR. Model selection and multimodel inference: a practical information-theoretic approach. New York (NY): Springer-Verlag; 2002.
-
- Calautti C, Leroy F, Guincestre JY, Baron JC. Dynamics of motor network overactivation after striatocapsular stroke: a longitudinal PET study using a fixed-performance paradigm. Stroke. 2001;32:2534–2542. - PubMed
Publication types
MeSH terms
Grants and funding
LinkOut - more resources
Full Text Sources
Medical
