. 2011 Apr 30;302(1-3):59-68.
doi: 10.1016/j.ijms.2010.08.002.

Methods for the Analysis of High Precision Differential Hydrogen Deuterium Exchange Data

Affiliations

Methods for the Analysis of High Precision Differential Hydrogen Deuterium Exchange Data

Michael J Chalmers et al. Int J Mass Spectrom. .

Abstract

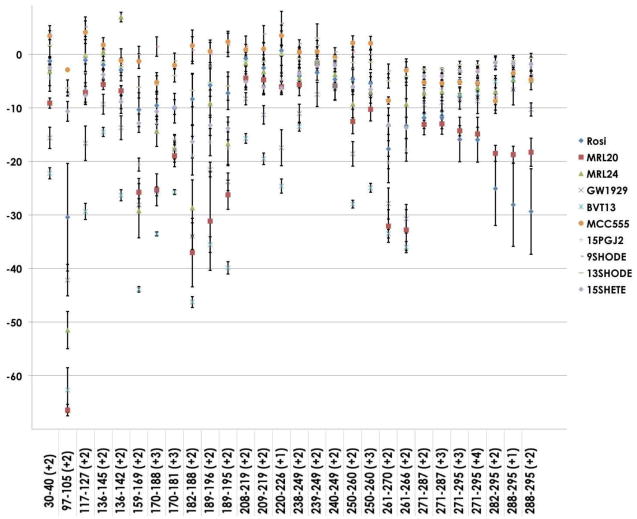
Hydrogen/deuterium exchange (HDX) mass spectrometry has been widely applied to the characterization of protein dynamics. More recently, differential HDX has been shown to be effective for the characterization of ligand binding. Previously we have described a fully automated HDX system for use as a ligand screening platform. Here we describe and validate the required data analysis workflow to facilitate the use of HDX as a robust approach for ligand screening. Following acquisition of HDX data at a single on-exchange time point (n ≥ 3), one way analysis of variance in conjunction with the Tukey multiple comparison procedure is used to establish the significance of any measured difference. Analysis results are graphed with respect to a single peptide, ligand or group of ligands, or displayed as an overview within a heat map. For the heat map display, only Δ%D values with a Tukey-adjusted P value less than 0.05 are colored. Hierarchical clustering is used to bin compounds with highly similar HDX signatures. The workflow is evaluated with a small data set showing the ligand binding domain (LDB) of the nuclear receptor peroxisome proliferator-activated receptor gamma (PPARγ) screened against 10 functionally selective ligands. More significantly, data for the vitamin D receptor (VDR) in complex with 87 ligands are presented. To highlight the robustness and precision of our automated HDX platform we analyzed the data from 4191 replicate HDX measurements acquired over an eight month timeframe. Ninety six percent of these measurements were within 10 percent of the mean value. Work has begun to integrate these analysis and graphing components within our HDX software suite.


Figures

Figure 1
Figure 1
Schematic representation of our differential HDX data analysis workflow.
Figure 2
Figure 2
(A). HDX data for PPARγ LBD in complex with full agonist rosiglitazone and the partial agonist MRL-24. A two tailed t-test of the 30s data showed no significant difference between ligand free PPAR (apo) and the rosliglitazone bound receptor. In contrast, a significant reduction in exchange was observed following binding of MRL-24. It should be noted that each differential HDX experiment contains its own “apo” internal control. For clarity, only the apo data associated with the rosiglitazone are displayed. There was complete overlap between the two apo samples (see text for a discussion on the repeatability of our automated platform for data acquisition). Figure 1(B). Differential HDX data for the PPARγ beta sheet region 159–169 ([M+2H]2+ ion) following 30s of exchange. Data are shown for 10 ligands of interest. The chart is annotated with the results from the Tukey multiple comparison test. The letters above each bar represent those ligands that exhibit a significant difference with a p-value <0.05. For example, A(rosi) is significantly different from B, C, D and E.
Figure 3
Figure 3
Differential HDX data for the H3 (A) and H12 (B) regions of the PPARγ LBD. Annotations to the bar chart correspond to the results from a Tukey multiple comparison test (P<0.05). Rosi, MRL20, MRL24, GW1929, BVT13 and MCC555 are synthetic PPARγ modulators. 15PGJ2, 9SHODE, 13SHODE, 15SHETE are putative endogenous ligands.
Figure 4
Figure 4
Heat map of differential HDX data for PPARγ LBD. Changes with Tukey-adjusted P-values <0.05 are colored according to the key. P-values > 0.05 are colored grey.
Figure 5
Figure 5
Differential HDX data for PPARγ LBD with 10 ligands.
Figure 6
Figure 6
Precision of the VDR LBD 30s HDX experiment over an eight month time period. The inset to the figure shows the mean and standard deviation for five peptides calculated from 127 replicate analysis. The peptide spanning residues 134–150 was measured to have a mean %D value of 51%D and a standard deviation of 3.7. The main panel to the figure plots the difference of each replicate from the mean (33 peptides × 127 replicates = 4191 values). Data are ordered from high to low values. 96 percent of all values are within 10% of the mean.
Figure 7
Figure 7
HDX heat map obtained from the analysis of VDR LBD in complex with 87 ligands of interest. Data are clustered and ordered according the the methods table. Changes with Tukey-adjusted P-values <0.05 are colored according to the key. P-values > 0.05 are colored grey.

References

    1. Engen JR. Analysis of Protein Conformation and Dynamics by Hydrogen/Deuterium Exchange MS. Analytical Chemistry. 2009;81(19):7870–7875. - PMC - PubMed
    1. Engen JR, Smith DL. Investigating protein structure and dynamics by hydrogen exchange MS. Analytical Chemistry. 2001;73(9):256a–265a. - PubMed
    1. Englander SW. Hydrogen exchange and mass spectrometry: A historical perspective. J Am Soc Mass Spectrom. 2006;17(11):1481–9. - PMC - PubMed
    1. Yan X, Maier CS. Hydrogen/deuterium exchange mass spectrometry. Methods Mol Biol. 2009;492:255–71. - PubMed
    1. Kaltashov IA, Bobst CE, Abzalimov RR. H/D exchange and mass spectrometry in the studies of protein conformation and dynamics: is there a need for a top-down approach? Anal Chem. 2009;81(19):7892–9. - PMC - PubMed

LinkOut - more resources