

SPARCL1, Shp2, MSH2, E-cadherin, p53, ADCY-2 and MAPK are prognosis-related in colorectal cancer
- PMID: 21528083
- PMCID: PMC3082758
- DOI: 10.3748/wjg.v17.i15.2028
SPARCL1, Shp2, MSH2, E-cadherin, p53, ADCY-2 and MAPK are prognosis-related in colorectal cancer
Abstract
Aim: To investigate the expression of markers that are correlated with the prognosis of colorectal cancer (CRC) patients.
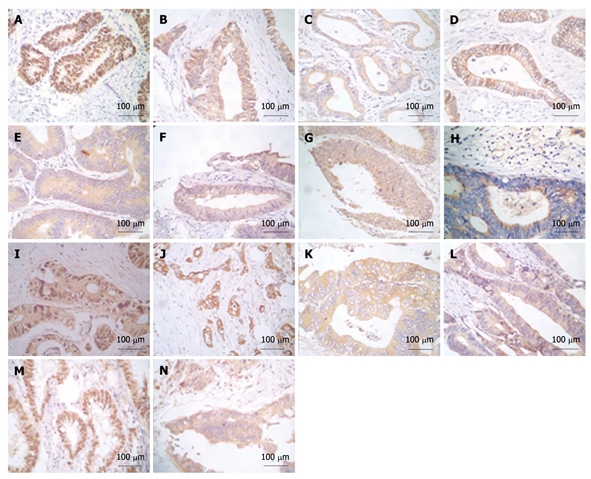
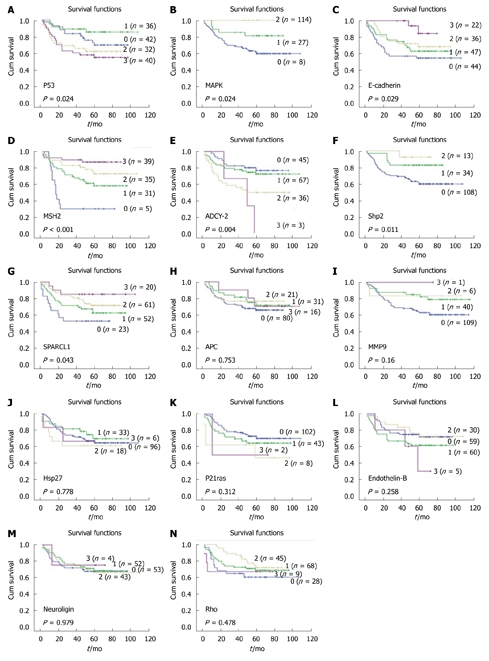
Methods: One hundred and fifty-six CRC patients were followed up for more than 3 years after radical surgery. Immunohistochemical (IHC) analysis was performed to detect the expression of 14 pathway-related markers (p53, APC, p21ras, E-cadherin, endothelin-B receptor, Shp2, ADCY-2, SPARCL1, neuroligin1, hsp27, mmp-9, MAPK, MSH2 and rho) in specimens from these patients. Bioinformatics analysis involving a Support Vector Machine (SVM) was used to determine the best prognostic model from combinations of these markers.
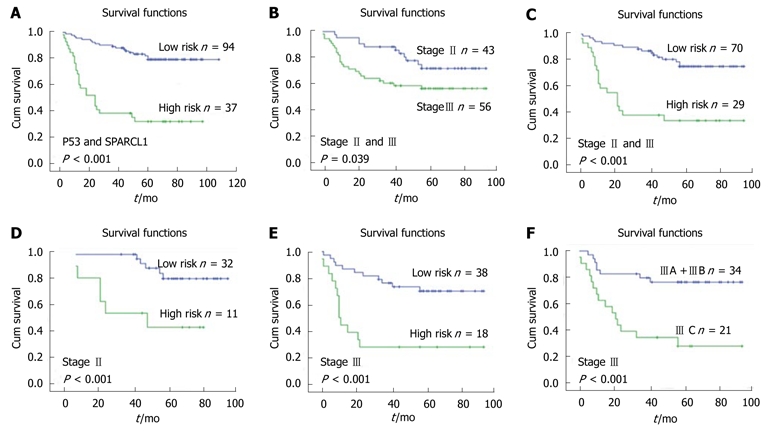
Results: Seven markers (SPARCL1, Shp2, MSH2, E-cadherin, p53, ADCY-2 and MAPK) were significantly related to the prognosis and clinical pathological features of the CRC patients (P < 0.05). Prognostic models were established through SVM from combinations of these 7 markers and proved able to differentiate patients with dissimilar survival, especially in stage II/III patients. According to the best prognostic model, the p53/SPARCL1 model, patients having high p53 and low SPARCL1 expression had about 50% lower 3-year survival than others (P < 0.001).
Conclusion: SPARCL1, Shp2, MSH2, E-cadherin, p53, ADCY-2 and MAPK are potential prognostic markers in CRC. A p53/SPARCL1 bioinformatics model may be used as a supplement to tumor-nodes-metastasis staging.
Keywords: Bioinformatics; Colorectal cancer; Prognosis; SPARCL1; p53.
Figures
Similar articles
-
SPARCL1 Is a Novel Prognostic Biomarker and Correlates with Tumor Microenvironment in Colorectal Cancer.Biomed Res Int. 2022 Jan 24;2022:1398268. doi: 10.1155/2022/1398268. eCollection 2022. Biomed Res Int. 2022. PMID: 35111844 Free PMC article.
-
Tissue microarray analysis of the prognostic value of E-cadherin, Ki67, p53, p27, survivin and MSH2 expression in upper urinary tract transitional cell carcinoma.Eur Urol. 2005 Nov;48(5):764-70. doi: 10.1016/j.eururo.2005.07.005. Epub 2005 Aug 1. Eur Urol. 2005. PMID: 16126329
-
Prognostic significance of BIRC7/Livin, Bcl-2, p53, Annexin V, PD-L1, DARC, MSH2 and PMS2 in colorectal cancer treated with FOLFOX chemotherapy with or without aspirin.PLoS One. 2021 Jan 19;16(1):e0245581. doi: 10.1371/journal.pone.0245581. eCollection 2021. PLoS One. 2021. PMID: 33465114 Free PMC article.
-
SPARCL1: a potential molecule associated with tumor diagnosis, progression and prognosis of colorectal cancer.Tumour Biol. 2011 Dec;32(6):1225-31. doi: 10.1007/s13277-011-0226-x. Epub 2011 Sep 2. Tumour Biol. 2011. PMID: 21887554
-
Secreted protein acidic and rich in cysteines-like 1 suppresses aggressiveness and predicts better survival in colorectal cancers.Clin Cancer Res. 2012 Oct 1;18(19):5438-48. doi: 10.1158/1078-0432.CCR-12-0124. Epub 2012 Aug 13. Clin Cancer Res. 2012. PMID: 22891198
Cited by
-
Current Understanding of the Role of Adenosine Receptors in Cancer.Molecules. 2024 Jul 26;29(15):3501. doi: 10.3390/molecules29153501. Molecules. 2024. PMID: 39124905 Free PMC article. Review.
-
Cytotoxic activity of Shp2 inhibitor fumosorinone in human cancer cells.Oncol Lett. 2018 Jun;15(6):10055-10062. doi: 10.3892/ol.2018.8593. Epub 2018 Apr 27. Oncol Lett. 2018. PMID: 29928374 Free PMC article.
-
A scoring system based on artificial neural network for predicting 10-year survival in stage II A colon cancer patients after radical surgery.Oncotarget. 2016 Apr 19;7(16):22939-47. doi: 10.18632/oncotarget.8217. Oncotarget. 2016. PMID: 27008710 Free PMC article.
-
Development of a high-throughput screening paradigm for the discovery of small-molecule modulators of adenylyl cyclase: identification of an adenylyl cyclase 2 inhibitor.J Pharmacol Exp Ther. 2013 Nov;347(2):276-87. doi: 10.1124/jpet.113.207449. Epub 2013 Sep 5. J Pharmacol Exp Ther. 2013. PMID: 24008337 Free PMC article.
-
Integrated bioinformatics investigation of adenylyl cyclase family co-expression network in bladder cancer followed by preliminary validation of member 2 (ADCY2) in tumorigenesis and prognosis.Transl Cancer Res. 2024 May 31;13(5):2222-2237. doi: 10.21037/tcr-23-1796. Epub 2024 May 23. Transl Cancer Res. 2024. PMID: 38881911 Free PMC article.
References
-
- Espey DK, Wu XC, Swan J, Wiggins C, Jim MA, Ward E, Wingo PA, Howe HL, Ries LA, Miller BA, et al. Annual report to the nation on the status of cancer, 1975-2004, featuring cancer in American Indians and Alaska Natives. Cancer. 2007;110:2119–2152. - PubMed
-
- Jemal A, Clegg LX, Ward E, Ries LA, Wu X, Jamison PM, Wingo PA, Howe HL, Anderson RN, Edwards BK. Annual report to the nation on the status of cancer, 1975-2001, with a special feature regarding survival. Cancer. 2004;101:3–27. - PubMed
-
- Parsons DW, Wang TL, Samuels Y, Bardelli A, Cummins JM, DeLong L, Silliman N, Ptak J, Szabo S, Willson JK, et al. Colorectal cancer: mutations in a signalling pathway. Nature. 2005;436:792. - PubMed
-
- Wood LD, Parsons DW, Jones S, Lin J, Sjöblom T, Leary RJ, Shen D, Boca SM, Barber T, Ptak J, et al. The genomic landscapes of human breast and colorectal cancers. Science. 2007;318:1108–1113. - PubMed
-
- Vapnik VN. Statistical Learning Theory. New York: Wiley, 1998
Publication types
MeSH terms
Substances
LinkOut - more resources
Full Text Sources
Medical
Research Materials
Miscellaneous
