. 2011 May 25;133(20):7737-7743.
doi: 10.1021/ja109620d. Epub 2011 Apr 29.

Population of nonnative states of lysozyme variants drives amyloid fibril formation

Affiliations

Population of nonnative states of lysozyme variants drives amyloid fibril formation

Alexander K Buell et al. J Am Chem Soc. .

Abstract

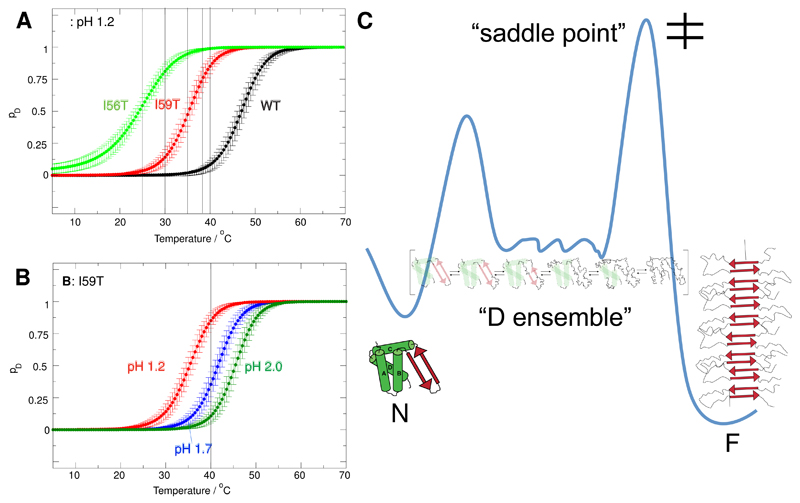
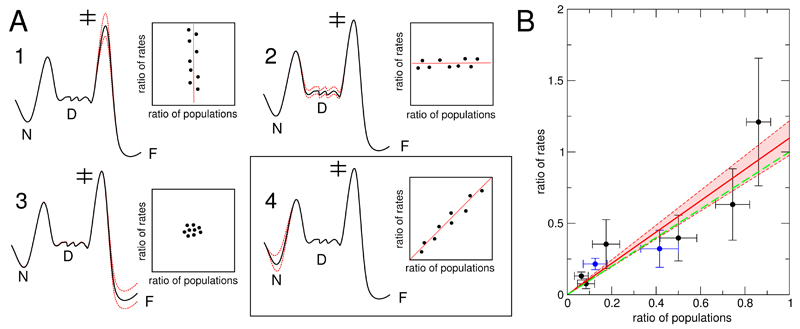
The propensity of protein molecules to self-assemble into highly ordered, fibrillar aggregates lies at the heart of understanding many disorders ranging from Alzheimer's disease to systemic lysozyme amyloidosis. In this paper we use highly accurate kinetic measurements of amyloid fibril growth in combination with spectroscopic tools to quantify the effect of modifications in solution conditions and in the amino acid sequence of human lysozyme on its propensity to form amyloid fibrils under acidic conditions. We elucidate and quantify the correlation between the rate of amyloid growth and the population of nonnative states, and we show that changes in amyloidogenicity are almost entirely due to alterations in the stability of the native state, while other regions of the global free-energy surface remain largely unmodified. These results provide insight into the complex dynamics of a macromolecule on a multidimensional energy landscape and point the way for a better understanding of amyloid diseases.


Figures

Figure 1
Figure 1
Growth rates of WT lysozyme fibril seeds in contact with solutions of the I59T or I56T variants (at pH 1.2, 100 mM NaCl and 35°C), measured through the changes in resonant frequency (f-f0) of the sensor system. The green bands indicate the times when the cell contained a solution of the protein under investigation. We used the average of the rates of frequency change of the three overtones with N = 3 (black line), 5 (blue) and 7 (red) as a measure for the aggregation rate. The differences between the mass sensitivities of the frequency overtones is discussed in the main text. The numerical values of the average for the three growth periods shown in this figure are: -12.8, -35.9 and -17.5 Hz/min. Within experimental error, the rate of mass addition depends only on the nature of the monomer, and not on the history of the seed fibrils. The insets show AFM images of the gold coated quartz crystal before and after a growth experiment, yielding an independent confirmation of the elongation of the surface-bound fibrils as the origin of the decrease in resonant frequency. Experiments such as these ones were used to compute the ratios of rates reported in Table S1 and a summary of which can be found in Table 1.
Figure 2
Figure 2
Comparison of the elongation rates of amyloid fibrils from lysozyme variants at different temperatures. The main part of the figure shows a direct comparison of the rates of monomer addition of all three proteins (WT, I59T and I56T) to WT seeds at 40°C (a similar experiment with I59T seeds is shown in Fig. S2 in the Supporting Information), demonstrating a large difference in absolute rates between the WT protein and the two variants. The two inserts show the fibril growth rates of the two variants at 25°C and 30°C and reveal that the relative kinetics are temperature dependent; at higher temperatures the aggregation rates are substantially more similar than at lower temperature. Equivalent experiments were used to compute the ratios of rates reported in Table S1, a summary of which can be found in Table 1.
Figure 3
Figure 3
(A) and (B): Amide I region of the FTIR spectra of WT (black) and I59T (red) fibrils grown at pH 1.2. The measured spectra are shown in thick black lines, whereas the deconvoluted Gaussian contributions are shown in thin lines (black for backbone and grey for side chains). The relative intensities are given in Table S3 in the Supporting Information. (C) and (D): Conformational stability of WT (black) and I59T fibrils (red) formed in the presence of WT seeds, measured by de-polymerization experiments performed using GdnSCN. Continuous lines represent fits to a sigmoidal function (see Supporting Information).
Figure 4
Figure 4
Growth of surface-bound I59T lysozyme fibrils in contact with solutions of I59T at different pH values and a constant ionic strength of I = 0.2 M, measured through the changes in resonant frequency of the sensor (T = 35°C). The green bands indicate the times when the cell was filled with a solution of the relevant protein, and the black vertical lines indicate a change in solution pH. The red lines show linear fits to the frequency shifts and provide a direct probe of the filament growth rate. A) pH 1.2 and 1.7; B) pH 1.2 and 2.0; the measurements in A and B were acquired using two different QCM sensors. Experiments such as these ones were used to compute the ratios of rates reported in Table S1, a summary of which can be found in Table 1.
Figure 5
Figure 5
Fractional populations pD of non-native denatured (D) states, derived from fitting near UV-CD data to a pseudo two-state model (native state, non-native ’denatured ensemble’). A) the I56T, I59T variants and WT lysozyme at pH 1.2. B) I59T at pH 1.2, pH 1.7 and 2.0. C) Free energy landscape of human lysozyme. The native state N is in equilibrium with the ’denatured ensemble D’, a collection of non-native states populated according to the Boltzmann distribution. In addition, the presence of fibril seeds makes the fibrillar state F accessible; the monomeric state is separated from the aggregated state by a free energy barrier. The relative stabilities of the various states can be modulated by changes in solution conditions and amino acid sequence. We use this free energy landscape model to rationalize the origin of increased amyloidogenicity of lysozyme variants.
Figure 6
Figure 6
A: Four scenarios of the influence of modifications in amino acid sequence and solution conditions on the free energy landscape are presented. Variations in energy are indicated with red dashed lines. Only modifications that change the energy difference between the lowest state on the energy landscape (“N”) and the saddle point for aggregation (“‡”) will change the aggregation rate (scenarios 1 and 4). Of those two cases, only the latter will lead to a direct relationship between ratios of rates and ratios of populations, with a limiting case of slope 1.0. Changes in the stability of the denatured ensemble (“D”) and the fibrillar state (“F”) do not influence the aggregation rate. B: Plot of the ratios of elongation rates and fractions of populations of non-native states (data from Table 1). The data shown in black correspond to pH 1.2, whereas the data shown in blue correspond to changes in pH for the I59T mutant (to pH 1.7 or 2.0). The linear fit (red) is given by the equation: y = a * x, with a = 1.10 ± 0.12 (correlation coefficient 0.90). The zone between the red dashed lines corresponds to the error in the fitting, as estimated by the variation in slope. As a guide to the eye, y = x is shown (green dashed line), the limiting case 4 and most direct link between the fraction of denatured states and aggregation rates. Our finding that the experimental data very closely follow this prediction indicates that our landscape model of lysozyme can be used to quantitatively understand the origin of amyloidogenicity.

References

    1. Pepys MB, Hawkins PN, Booth DR, Vigushin DM, Tennent GA, Soutar AK, Totty N, Nguyen O, Blake CC, Terry CJ. Nature. 1993;362:553–557. - PubMed
    1. Takano K, Funahashi J, Yutani K. Eur J Biochem. 2001;268:155–159. - PubMed
    1. Booth DR, Sunde M, Bellotti V, Robinson CV, Hutchinson WL, Fraser PE, Hawkins PN, Dobson CM, Radford SE, Blake CC, Pepys MB. Nature. 1997;385:787–793. - PubMed
    1. Canet D, Last AM, Tito P, Sunde M, Spencer A, Archer DB, Redfield C, Robinson CV, Dobson CM. Nat Struct Biol. 2002;9:308–315. - PubMed
    1. Dumoulin M, Canet D, Last AM, Pardon E, Archer DB, Muyldermans S, Wyns L, Matagne A, Robinson CV, Redfield C, Dobson CM. J Mol Biol. 2005;346:773–788. - PubMed

Publication types