. 2011 Apr 29;145(3):410-22.
doi: 10.1016/j.cell.2011.03.031.

Induced ectopic kinetochore assembly bypasses the requirement for CENP-A nucleosomes

Affiliations

Induced ectopic kinetochore assembly bypasses the requirement for CENP-A nucleosomes

Karen E Gascoigne et al. Cell. .

Abstract

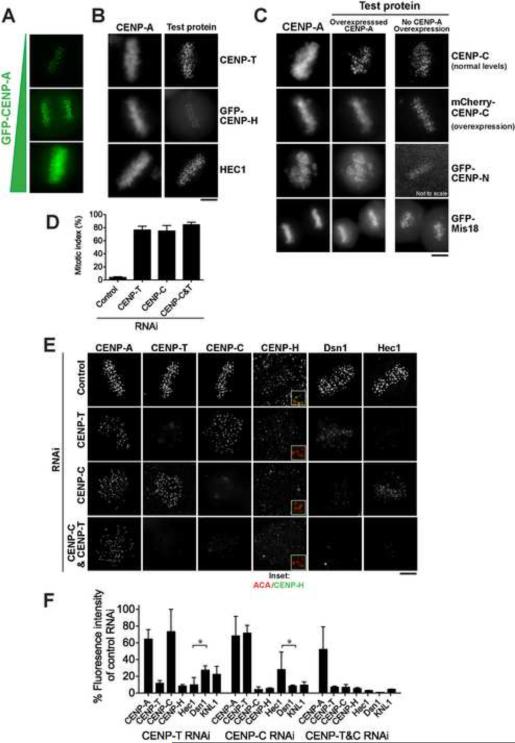
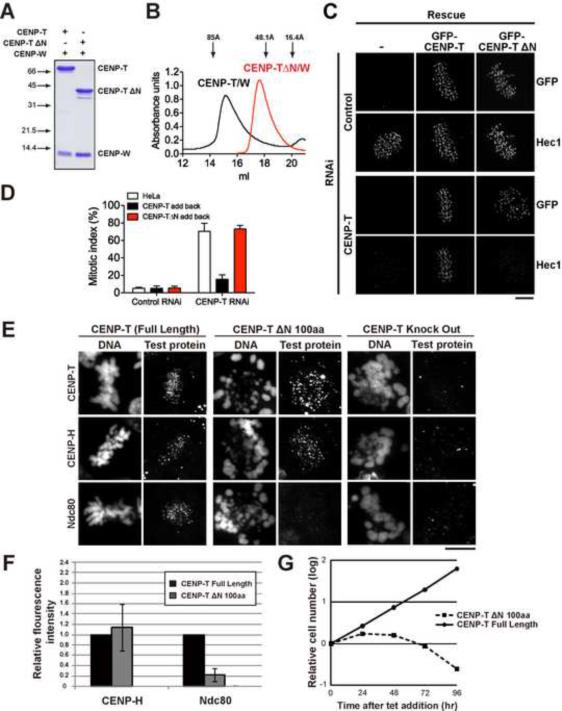
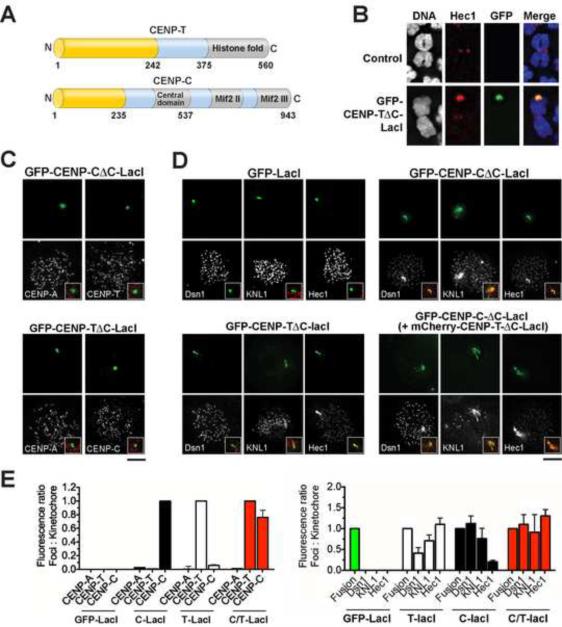
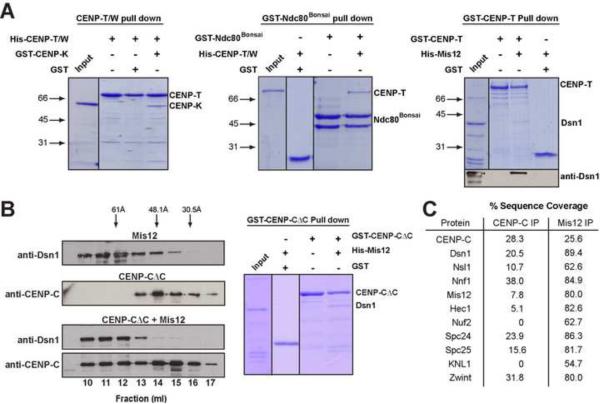
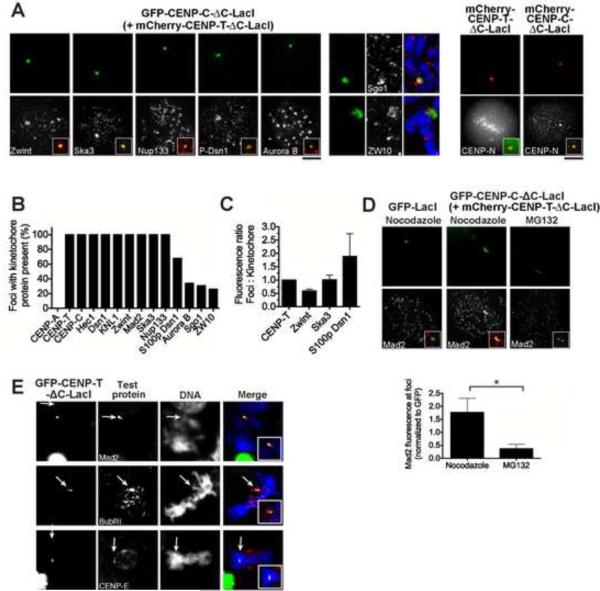
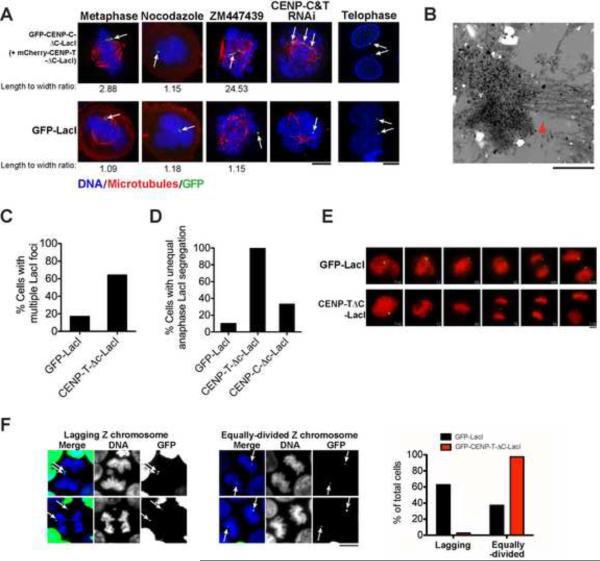
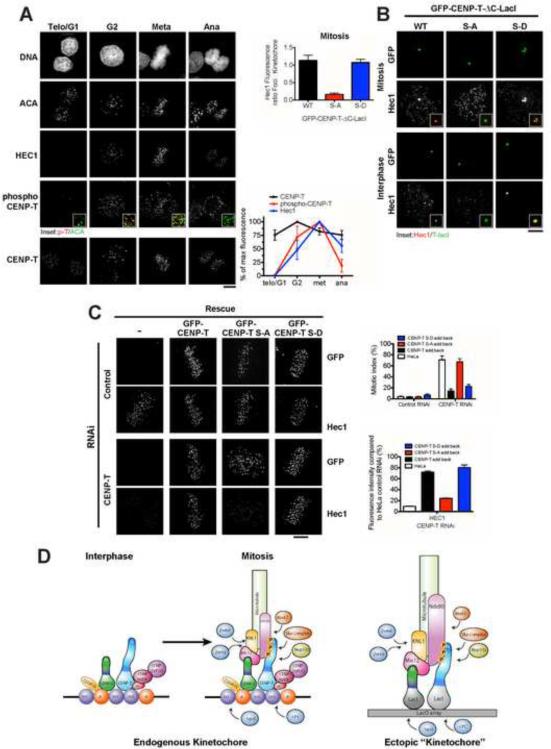
Accurate chromosome segregation requires assembly of the multiprotein kinetochore complex at centromeres. Although prior work identified the centromeric histone H3-variant CENP-A as the important upstream factor necessary for centromere specification, in human cells CENP-A is not sufficient for kinetochore assembly. Here, we demonstrate that two constitutive DNA-binding kinetochore components, CENP-C and CENP-T, function to direct kinetochore formation. Replacing the DNA-binding regions of CENP-C and CENP-T with alternate chromosome-targeting domains recruits these proteins to ectopic loci, resulting in CENP-A-independent kinetochore assembly. These ectopic kinetochore-like foci are functional based on the stoichiometric assembly of multiple kinetochore components, including the microtubule-binding KMN network, the presence of microtubule attachments, the microtubule-sensitive recruitment of the spindle checkpoint protein Mad2, and the segregation behavior of foci-containing chromosomes. We additionally find that CENP-T phosphorylation regulates the mitotic assembly of both endogenous and ectopic kinetochores. Thus, CENP-C and CENP-T form a critical regulated platform for vertebrate kinetochore assembly.


Figures

Figure 1
Figure 1. Differential roles of CENP-A, the CENP-T/W complex, and CENP-C in kinetochore assembly
(A) Images of HeLa cells with increasing levels of GFP-CENP-A expression. CENP-A localizes to chromosome arms at high expression levels. (B) Representative images of kinetochore components not mis-localized by CENP-A overexpression, visualized using anti-CENP-T and anti-Hec1 antibodies, or GFPLAP-CENP-H. (C) Images showing mis-localization of kinetochore components to chromosome arms in the presence of ectopic CENP-A relative to a GFP-H2B control. CENP-C was visualized by immunofluorescence, or by co-overexpression of mCherry-CENP-C. CENP-N or Mis18 were visualized using HeLa cell lines stably expressing GFPLAP fusions. (D) Graph showing quantification of mitotic index 48 h after the indicated depletions by RNAi. N=100 cells/condition, +/− SEM. (E) Representative immunofluorescence images of HeLa cells 48 h after RNAi depletion of the indicated proteins. Merge insets show ACA (red), CENP-H (green). (F) Quantification of kinetochore intensity 48 h following RNAi depletion of CENP-C, CENP-T, or CENP-C & CENP-T. N > 50 kinetochores, ≥ 5 cells, +/− SD. Asterisk indicates significant difference as determined by Mann Whitney U test P<0.005. Scale bars, 5 μm. Also see Fig. S1.
Figure 2
Figure 2. The CENP-T N-terminus is required kinetochore assembly
(A) Coomassie-stained gel showing bacterially purified recombinant full length 6xHis-CENP-T/CENP-W or CENP-T-ΔN/CENP-W, lacking aa 1–288. (B) Graph showing the elution profile (OD280) of recombinant CENP-T/W complex and CENP-T-ΔN/W on a Superose 6 size exclusion column. Arrows indicate the migration of standards with known Stokes radii: Thyroglobulin (85 Å), Aldolase (48.1 Å) and RNase A (16.4 Å). (C) Immunofluorescence images showing levels of Hec1/Ndc80 48 h after RNAi depletion of CENP-T in HeLa cells or HeLa cell lines expressing RNAi resistant GFP-CENP-T or GFP-CENP-T-ΔN. Scale bar, 5 μm. (D) Graph showing quantification of the mitotic index 48 h after RNAi depletion of CENP-T in HeLa cells, or HeLa cell lines expressing RNAi resistant CENP-T or CENP-T ΔN. N=100 cells, +/− SEM. (E) Representative immunofluorescence images of chicken DT40 cells after depletion of endogenous CENP-T and expression of the indicated protein fragments. Scale bar, 10 μm. (F) Quantification of kinetochore intensity after depletion of CENP-T and expression of the indicated proteins. N = 200, +/− SD. (G) Graph showing viability of CENP-T conditional-depletion in DT40 cells expressing the indicated proteins after addition of tetracycline. Also see Fig. S2.
Figure 3
Figure 3. Targeting of CENP-C-LacI and CENP-T-LacI to an ectopic focus causes mis-localization of the KMN network
(A) Schematic representation of CENP-T and CENP-C. The N-terminal regions used in fusion protein experiments are indicated in yellow (amino acids 1–242 for CENP-T and 1–235 for CENP-C). DNA binding regions are indicated in gray (Hori et al., 2008; Yang et al., 1996). (B) Immunofluorescence images showing representative metaphase chromosome spreads from U2OS-LacO cells. Bottom, chromosome 1 with GFP-CENP-T-ΔC-LacI present at the LacO array. (C) Immunofluorescence images showing only centromeric localization of DNA binding kinetochore proteins in cells transiently expressing GFP-CENP-T-ΔC-LacI or GFP-CENP-C-ΔC-LacI after 15 h Nocodazole treatment. Insets show a merge of kinetochore protein (red) and LacI foci (green). (D) Immunofluorescence images showing co-localization of KMN network proteins with LacI foci in cells transiently expressing GFP-CENP-T-ΔC-LacI or GFP-CENP-C-ΔC-LacI, or co-expressing mCherry-CENP-T-ΔC-LacI (not shown) and GFP-CENP-C-ΔC-LacI. Insets show a merge of kinetochore protein (red) and LacI foci (green). (E) Quantitation of the relative fluorescence of the indicated kinetochore proteins at endogenous kinetochores versus ectopic foci in cells expressing LacI fusion proteins. Quantification was conducted after 15 h nocodazole treatments, >10 cells/condition, 20 kinetochores/cell, +/− SEM. Data is shown normalized to the foci/kinetochore ratio of the fusion protein. Also see Fig. S3 and Movie S4.
Figure 4
Figure 4. The CENP-T/W complex and CENP-C interact directly with KMN network components in vitro
(A) The CENP-T/W complex binds directly to CENP-K, GST-Ndc80Bonsai, and the Mis12 complex in vitro. Left, Coomassie-stained gel showing 6xHis-CENP-T/W complex immobilized on Ni-NTA agarose resin, alone or in the presence of GST or GST-CENP-K. Middle, Coomassie-stained gel showing 6xHis-CENP-T/W complex binding to either GST-Ndc80Bonsai or GST immobilized on glutathione agarose. Right, Coomassie-stained gel (top) and Western blot probed with anti-Dsn1 antibodies (bottom) showing GST-CENP-T or GST immobilized on glutathione agarose in the presence of 6xHis tagged Mis12 complex. (B) CENP-C binds directly to the Mis12 complex in vitro. Western blot probed with the indicated antibodies showing the elution profile by size exclusion chromatography for GST-CENP-C ΔC (amino acids 1–235) alone (top panel) or shifted in the presence of pre-assembled Mis12 complex (bottom panels). Arrows indicate the migration of standards with known Stokes radii: Ferritin (61 Å), Aldolase (48.1 Å) and Ovalbumin (30.5 Å). Bottom figure, Coomassie-stained gel showing GST-CENP-C ΔC or GST immobilized on glutathione agarose, alone or in the presence of the Mis12 complex. (C) Percent sequence from the mass spectrometric analysis of one step immunoprecipitations of either CENP-C, or LAPGFP-Mis12. Diverse samples prepared using identical conditions serve as negative controls for these purifications.
Figure 5
Figure 5. Induced CENP-T and CENP-C foci recruit regulatory and outer kinetochore proteins
(A) Left, immunofluorescence images showing co-localization of kinetochore proteins with LacI foci in cells transiently co-expressing mCherry-CENP-T-ΔC-LacI (not shown) and GFP-CENP-C-ΔC-LacI after 15 h Nocodazole treatment. Inserts show a merge of kinetochore protein (red) and LacI foci (green). Right, co-localization of GFP-CENP-N in cells expressing mCherry-CENP-T-ΔC-LacI or mCherry-CENP-C-ΔC-LacI. (B) Quantification of the percentage of focus-containing cells with the indicated kinetochore protein at the ectopic site. N ≥ 20. (C) Quantification of the relative fluorescence of the indicated kinetochore proteins at kinetochores versus ectopic foci, in cells expressing LacI fusion proteins. Quantification was done after 15 h nocodazole treatment, N ≥ 10 cells/condition, 20 kinetochores/cell, +/− SEM. Data are shown normalized to the foci/kinetochore ratio of the fusion protein. (D) Top, Immunofluorescence images showing co-localization of Mad2 with LacI foci in cells transiently co-expressing mCherry-CENP-T-ΔC-LacI (not shown) and GFP-CENP-C-ΔC-LacI after 15 h Nocodazole treatment, or 1 h treatment with MG132. Bottom, Quantification of Mad2 fluorescence at ectopic foci after 15 h nocodazole treatment or 1 h treatment with MG132, N ≥ 10 cells/condition, 20 kinetochores/cell, +/− SEM. Asterisk indicates significant difference as determined by Mann Whitney U test P<0.005. Data are shown normalized to GFP fluorescence at ectopic foci. (E) Immunofluorescence images showing co-localization of SAC proteins with LacI foci in chicken DT40 cells containing a LacO array, and expressing GFP-CENP-T-ΔC-LacI. Scale bar, 10 μm. Also see Fig. S4
Figure 6
Figure 6. Induced CENP-T and CENP-C foci interact with microtubules and function in chromosome segregation
(A) Representative immunofluorescence images of cells expressing GFP-LacI, or co-expressing RNAi resistant mCherry-CENPT-ΔC-LacI (not shown) and GFP-CENP-C-ΔC-LacI. Microtubules are shown in red. Cells were treated with 2 μM ZM447439 or 3.3 μM Nocodazole, or 48 h CENP-C and CENP-T RNAi as indicated. In all cases, cells were cold treated for 20 min prior to fixation to visualize stable kinetochore microtubule fibers. Arrows indicate the foci. The mean length/width ratio for the foci is shown below the indicated images. N >5 cells. (B) Electron micrographs of an ectopic CENP-T-LacI foci showing the presence of microtubule attachments (red arrow). Dark spots indicate immuno-labeling with anti-Hec1 antibody. This ectopic CENP-T-LacI foci was defined by the size and extensive anti-Hec1 labeling of this structure relative to an endogenous kinetochore. Direct correlative light-EM is shown to analyze ectopic kinetochore structure in Fig. S5. (C) Graph showing the percentage of cells with more than one LacI foci 72 h after expression of GFP-LacI or GFP-CENP-T-ΔC-LacI. N=200 cells (D) Graph showing quantification of LacI foci segregation in live cells expressing GFP-LacI, GFP-CENP-T-ΔC-LacI, or GFP-CENP-C-ΔC-LacI. (E) Selected images from time-lapse movies of U2OS-LacO cells expressing mCherry-histone-H2B to visualize chromatin, and GFPCENP-T-ΔC-lacI or GFP-LacI showing segregation of LacI foci at anaphase. Time in shown in minutes after NEBD. Scale bars, 5 μm. (F). Centromere replacement assay in chicken DT40 cells (see Fig. S6 for a schematic of this strategy). Left and middle panels; representative images of DT40 cells with GFP-LacI fusion protein localized to a LacO array on the Z chromosome (arrows), after Cre recombinase mediated excision of the centromeric region of the same chromosome. Left, representative images of the effected chromosome lagging at anaphase. Middle, representative images of correct segregation of the Z chromosome. Right panel; graph showing the percentage of GFP foci containing cells with lagging or equally dividing Z chromosomes 18 h after addition of tamoxifen to induce excision of the endogenous centromere cells. N=78 cells per condition. Also see Fig. S5 and movies S1–S4.
Figure 7
Figure 7. Mitotic kinetochore assembly is regulated by phosphorylation of CENPT by CDK
(A) Immunofluorescence images of Hela cells at the indicated cell cycle stages. Right panel shows quantification of CENP-T, phospho-CENP-T and Hec1 levels at centromeres, N ≥ 10 cells/condition, 20 kinetochores/cell, +/− SEM. Scale bars, 5 μm. (B) Immunofluorescence images showing levels of Hec1/Ndc80 at ectopic foci in mitotic and interphase U20S LacO cells expressing LacI fusions of: GFP-CENP-T, GFP-CENPT S-A (S or T to A mutations at amino acids 11, 27, 47, 85 and 195), or GFP-CENP-T S-D (S or T to D mutations at amino acids 11, 27, 85). Graph shows the relative fluorescence of Hec1/Ndc80 at kinetochores versus ectopic foci, in mitotic cells expressing the indicated CENP-T LacI fusion proteins. Quantification was done after 15 h nocodazole treatment, N ≥ 10 cells/condition, 20 kinetochores/cell, +/− SEM. Data is shown normalized to the foci/kinetochore ratio of CENP-T. (C) Left panels: Immunofluorescence images showing levels of Hec1/Ndc80 48 h after RNAi depletion of CENP-T in HeLa cells or HeLa cell lines expressing RNAi resistant GFP-CENP-T, GFP-CENP-T S-A or GFP-CENP-T S-D. Right panels: Quantification of mitotic index and Hec1/Ndc80 levels, after RNAi depletion of CENP-T and add back of the indicated GFP-CENP-T proteins, +/− SEM. (D) Model depicting interactions at endogenous and ectopic kinetochores. Also see Fig. S6.

References

    1. Amano M, Suzuki A, Hori T, Backer C, Okawa K, Cheeseman IM, Fukagawa T. The CENP-S complex is essential for the stable assembly of outer kinetochore structure. The Journal of Cell Biology. 2009:1–10. - PMC - PubMed
    1. Carroll CW, Milks KJ, Straight AF. Dual recognition of CENP-A nucleosomes is required for centromere assembly. J Cell Biol. 2010;189:1143–1155. - PMC - PubMed
    1. Carroll CW, Silva MC, Godek KM, Jansen LE, Straight AF. Centromere assembly requires the direct recognition of CENP-A nucleosomes by CENP-N. Nat Cell Biol. 2009;11:896–902. - PMC - PubMed
    1. Cheeseman IM. A Combined Approach for the Localization and Tandem Affinity Purification of Protein Complexes from Metazoans. Science's STKE. 2005;2005:pl1–pl1. - PubMed
    1. Cheeseman IM, Desai A. Molecular architecture of the kinetochore- microtubule interface. Nat Rev Mol Cell Biol. 2008;9:33–46. - PubMed

Publication types