Review
. 2011 Aug;278(1-2):2-20.
doi: 10.1016/j.heares.2011.04.003. Epub 2011 Apr 21.

The spiral ganglion: connecting the peripheral and central auditory systems

Affiliations
Review

The spiral ganglion: connecting the peripheral and central auditory systems

Bryony A Nayagam et al. Hear Res. 2011 Aug.

Abstract

In mammals, the initial bridge between the physical world of sound and perception of that sound is established by neurons of the spiral ganglion. The cell bodies of these neurons give rise to peripheral processes that contact acoustic receptors in the organ of Corti, and the central processes collect together to form the auditory nerve that projects into the brain. In order to better understand hearing at this initial stage, we need to know the following about spiral ganglion neurons: (1) their cell biology including cytoplasmic, cytoskeletal, and membrane properties, (2) their peripheral and central connections including synaptic structure; (3) the nature of their neural signaling; and (4) their capacity for plasticity and rehabilitation. In this report, we will update the progress on these topics and indicate important issues still awaiting resolution.


Figures

Figure 1
Figure 1
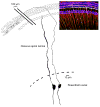
Light micrographs of representative type I and type II spiral ganglion neurons. (A) HRP-labeled neurons from a cat that reveal the central and peripheral processes. Note for the bipolar type I neuron, the peripheral process (left side) is very thin (<0.5 μm), in comparison to the central process (right side). In contrast, the processes of the pseudomonopolar type II neuron are approximately equal in caliber. Scale bar equals 10 μm. (Kiang et al., 1982) (B) Cresyl violet stained type I and II neurons from a rat. Note that the cytoplasm of the type I neurons is prominent and blotchy with a pale nucleus; in contrast, the type II cytoplasm is pale. This staining illustrates the differential content of Nissl substance. (C) Protargol stained cells from panel B after cresyl violet was rinsed off. Note that the type I cytoplasm does not stain much for neurofilaments, whereas the cytoplasm of the type II neuron does. (From Berglund and Ryugo, 1986)
Figure 2
Figure 2
Photomicrograph of spiral ganglion of rat stained using (A) cresyl violet and (B) fluorescent antibody directed against RT-97 that stains the phosphorylated 200 kD neurofilament protein. The light staining cytoplasm of type II neurons using cresyl violet is prominently stained by the antibody, RT-97. This selective and distinctive staining allowed the authors to determine that type II ganglion neurons were uniformly distributed along the length of Rosenthal’s canal. Scale bar equals 10 μm. (From Berglund and Ryugo, 1986)
Figure 3
Figure 3
Fluorescence confocal microscopy illustrating type II innervation of outer hair cells in the apical region of early post-natal rat cochlea. Using antibodies against peripherin and neurofilaments, type I processes (peripherin negative) can be readily distinguished from type II processes (peripherin positive), facilitating experimental studies of innervation, synaptogenesis and remodeling in the early post-natal cochlea. Myosin VIIa positive hair cells are shown in blue (A-C), type I and II ganglion neurons processes are shown in red (neurofilament 200 kDa; A) and type II specific peripherin expressing processes are shown in green (B). All three labels are overlaid in (C). Nayagam, unpublished data; scale bar equals 20 μm (A-C)
Figure 4
Figure 4
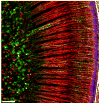
Type I and II spiral ganglion neuron ratio and innervation pattern in the early post-natal rat cochlea, shown using type II specific peripherin (green), pan neuronal marker, neurofilament (red) and Myosin VIIa positive hair cells (blue). Low magnification confocal micrograph depicts large numbers of type II peripherin positive (green) somata located at the periphery of the spiral ganglion. Nayagam, unpublished data; scale bar equals 100 μm.
Figure 5
Figure 5
These plots compare somatic cell sizes and process-size ratios for samples of spiral ganglion cells from a variety of species. Somatic size is represented by silhouette area. For the human data only (f), circles represent data from pseudomonopolar cells, collected from a 38-year-old male without a history of hearing loss who died from bladder cancer. Note how the two cell populations segregate into separate clusters on the basis of cell size and process ratio (From Kiang et al., 1984).
Figure 6
Figure 6
Composite drawing tube reconstructions of HRP-labeled type I and type II neurons. The morphology of these neurons is representative of middle and basal turns of the mouse cochlea. [inset] Confocal fluorescence photomicrograph illustrates a similar innervation pattern in the early post-natal rat cochlea, depicting Myosin VIIa labeled hair cells (blue), peripherin positive type II processes (green) and neurofilament positive type I and II processes (red). Each technique confers it own advantages experimentally; individual cell reconstructions are difficult but enable tracing of individual ganglion cell processes to peripheral and central targets, whereas immunocytochemistry gives an indication of the biochemistry of the population of ganglion cells (Modified from Berglund and Ryugo, 1987)
Figure 7
Figure 7
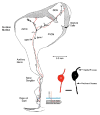
Schematic drawing of spiral ganglion neurons and their central and peripheral terminations. The type I neuron (black) innervates a single inner hair cell and projects in a topographic fashion into the cochlear nucleus. Fibers that innervate the basal hair cells project to dorsal regions of the cochlear nucleus, whereas fibers that innervate more apical hair cells project to progressively more ventral regions. This type I neuron is representative of its group. Note that a representative type II neuron (red) has a similar central projection pattern but with additional terminations in the granule cell domain. (Adapted from Brown et al., 1988).
Figure 8
Figure 8
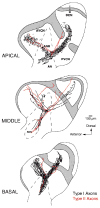
Reconstructions of the cochlear nuclei from three separate mice, as viewed in sections collected parallel to the lateral surface of the nucleus and collapsed into a single plane. The labeled type I (black) and type II (red) fibers resulted from HRP injections into the different regions of the cochlea. Note that the fibers maintain their respective topography in their central projections with type II fibers having a preference for the granule cell domain. Abbreviations: AN, auditory nerve; ANN, auditory nerve nucleus; ANR, auditory nerve root; AVCN, anteroventral cochlear nucleus; DCN, dorsal cochlear nucleus; PVCN, posteroventral cochlear nucleus. (Adapted from Berglund and Brown, 1994)
Figure 9
Figure 9
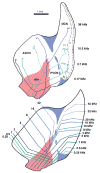
(Top) Cochleotopic projections of type I auditory nerve fibers in cat as shown for the left cochlear nucleus in a side view. These fibers were stained using intracellular recording and dye injections, and reconstructed through serial sections. (Bottom) The projection reflects the tonotopic organization of neurons of the cochlear nucleus (Bourk et al., 1981). The correspondence of AN projections to the tonotopic organization of the AVCN implies that AN fibers and their terminations establish tonotopy in the nucleus. Abbreviations: ANR, auditory nerve root; AVCN, anteroventral cochlear nucleus; DCN, dorsal cochlear nucleus; PVCN, posteroventral cochlear nucleus. (From Ryugo and Parks, 2003).
Figure 10
Figure 10
Cochleotopic projection of auditory nerve fibers in mouse as shown in a lateral view for the left cochlear nucleus reconstructed from serial sections. Auditory nerve fibers were labeled with fluorescent dextran amine after extracellular multiunit characterization of best frequency. Each stripe (or noodle) represents the extent of labeling within a single section. A three-dimensional atlas of the nucleus was made and projections from four different mice were inserted (Muniak et al., 2011). Note the creation of spatially separate “isofrequency sheets” by the linking of individual stripes. This organization holds true for much of the nucleus but note how the AN root region is complicated by all the intermingling of fibers of different frequencies.
Figure 11
Figure 11
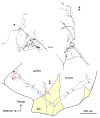
Drawing tube reconstructions of a low SR auditory nerve fiber (black and red, CF=3.1 kHz; SR=0.2 s/s; Th=26 dB SPL) and a high SR auditory nerve fiber (blue, CF=1.2 kHz, SR=86 s/s; Th= -3 dB) as viewed laterally. The ascending branches take a relatively straight trajectory through the AVCN. Low SR fibers are distinctive by the collaterals that arborize within the small cell cap (red). Otherwise, the main parts of the ascending and descending branches are similar for the different SR fiber types (black, low SR; blue, high SR). Higher magnification drawings are shown for each collateral. One collateral ramifies anterior to the endbulb (*), whereas the other ramifies laterally (**). The collaterals of high threshold, low SR fibers ramify extensively within the small cell cap and are good candidates for serving as the afferent limb of the high threshold circuit that feeds back to the organ of Corti by way of the olivocochlear system (Ye et al., 2000). Abbreviations: ab, ascending branch; ANr, auditory nerve root; AVCN, anteroventral cochlear nucleus; db, descending branch; PVCN, posteroventral cochlear nucleus. The scale bar equals 25 μm for the high magnification collateral drawings (top) and 0.5 mm for the orientation drawing (bottom). (Adapted from Fekete et al., 1984 and Ryugo, 2008)
Figure 12
Figure 12
This figure presents three reconstructed low SR fibers in the cochlear nucleus in side view. The collaterals that innervate the small cell cap rostrally and laterally are shown in red. (A) CF=1.2 kHz, SR=1.0 s/s, Th=4 dB SPL; (B) CF=1.85 kHz, SR=0 s/s, Th=50 dB SPL; (C) CF=0.3 kHz, SR=0.1 s/s, Th=39 dB SPL. The distributed terminals from these collaterals have areal spread over the nucleus yet are also confined to a thin zone squeezed between the outermost GCD and the underlying magnocellular core. Since low SR fibers have high thresholds, their activation by intense sounds would tend to produce a divergent spread of activity to neurons of the small cell cap. This divergence would recruit additional neurons, which could be important because for many AN fibers, increased sound level does not result in increased spike rates (Kiang et al., 1965). Abbreviations: ab, ascending branch; ANr, auditory nerve root; AVCN, anteroventral cochlear nucleus; db, descending branch; PVCN, posteroventral cochlear nucleus. Scale bar equals 0.5 mm. (From Ryugo, 2008)
Figure 13
Figure 13
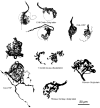
Large axosomatic endings are formed by auditory nerve fibers across a wide variety of animals. Their size implies a powerful influence upon the postsynaptic neuron, and their function has been inferred to mediate precise temporal processing. The evolutionary conservation further argues for survival advantages conferred by accurate timing information for sound localization acuity and auditory discrimination skills. Chick endbulbs are from Jhaveri and Morest, 1982, Plenum Press; owl endbulbs are from Carr and Boudreau, 1996, Wiley-Liss Publishers; mouse endbulbs are from Limb and Ryugo, 2000, Springer-Verlag Publishers; cat endbulbs are from Ryugo et al., 1998, Wiley-Liss Publishers, and Sento and Ryugo, 1989, Alan R. Liss Publishers; monkey endbulb is from Ryugo, unpublished data; human endbulb is from Adams, 1986, American Medical Association. (From Ryugo and Parks, 2003)
Figure 14
Figure 14
Drawings that illustrate the inferred sequence of development for a single endbulb of Held and its postsynaptic spherical bushy cell. Stage I and II endbulbs are found during the first three postnatal weeks; the endbulb situated between stage II and III is 45 days of age; Stage III endbulbs are representative of 6 month old cats. The dramatic structural changes that occur with maturation emphasize the need to recognize age as an important variable when conducting experiments and interpreting data. (From Ryugo and Fekete, 1982).
Figure 15
Figure 15
Drawing tube reconstructions of endbulbs of Held from adult cats with normal hearing, early onset hearing loss, and congenital deafness. The loss of structural complexity as indicated by fractal value is graded and correlated to the degree of hearing loss (Ryugo et al., 1998).
Figure 16
Figure 16
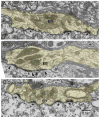
Electron micrographs of endbulbs of Held (EB, highlighted in yellow) from normal hearing cats (A, B). The micrographs show the typical dome-shaped appearance of PSDs (*) and associated synaptic vesicles. The drawings (A’–B’) display corresponding en face views of the three-dimensional reconstructions, illustrating the surface of the SBC that lies beneath the endbulb. Each PSD from serial sections (A’, B’) is shown (yellow) and horizontal lines indicate section edges. The red area highlights the section of the EB series shown in the electron micrographs. Scale bars equal 0.5 μm. (From O’Neil et al., 2010)
Figure 17
Figure 17
Electron micrographs of EB profiles (yellow) from congenitally deaf cats (A, B). These endbulbs display the abnormally long and flattened PSDs (*) and heightened clustering of associated synaptic vesicles. The three-dimensional reconstructions (A’, B’) illustrate the hypertrophy of the PSDs (yellow). The horizontal lines mark the section edges and the red strip highlights the section of the EB series shown in the above micrographs. Scale bars equal 0.5 μm. (From O’Neil et al., 2010)
Figure 18
Figure 18
Electron micrographs of endbulb (EB) synapses from (A) a normal hearing cat, (B) a congenitally deaf cat; and (C) a congenitally deaf cat that received approximately 3 months of electrical stimulation from a cochlear implant. All micrographs were collected from cats that were 6 months of age. Note that the synapses of the cochlear implant cat are restored to near normal as they are punctate, curved and accompanied by a normal complement of synaptic vesicles (asterisks). Scale bar equals 0.5 μm. (From Ryugo et al., 2005)

References

    1. Adamo NJ, Daigneault EA. Ultrastructural features of neurons and nerve fibres in the spiral ganglia of cats. J Neurocytol. 1973;2:91–103. - PubMed
    1. Adams JC. Neuronal morphology in the human cochlear nucleus. Arch Otolaryngol Head Neck Surg. 1986;112:1253–1261. - PubMed
    1. Agterberg MJ, Versnel H, van Dijk LM, de Groot JC, Klis SF. Enhanced survival of spiral ganglion cells after cessation of treatment with brain-derived neurotrophic factor in deafened guinea pigs. J Assoc Res Otolaryngol. 2009;10:355–367. - PMC - PubMed
    1. Alving BM, Cowan WM. Some quantitative observations on the cochlear division of the eighth nerve in the squirrel monkey (Saimiri sciureus) Brain Res. 1971;25:229–239. - PubMed
    1. Araki S, Kawano A, Seldon L, Shepherd RK, Funasaka S, Clark GM. Effects of chronic electrical stimulation on spiral ganglion neuron survival and size in deafened kittens. Laryngoscope. 1998;108:687–695. - PubMed

Publication types

Substances