

Identification of noncoding transcripts from within CENP-A chromatin at fission yeast centromeres
- PMID: 21531710
- PMCID: PMC3123123
- DOI: 10.1074/jbc.M111.228510
Identification of noncoding transcripts from within CENP-A chromatin at fission yeast centromeres
Abstract
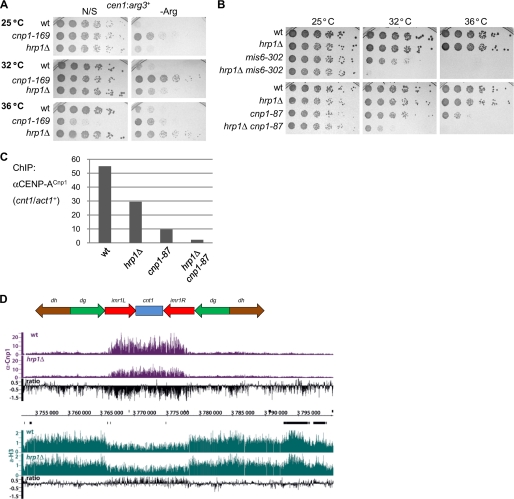
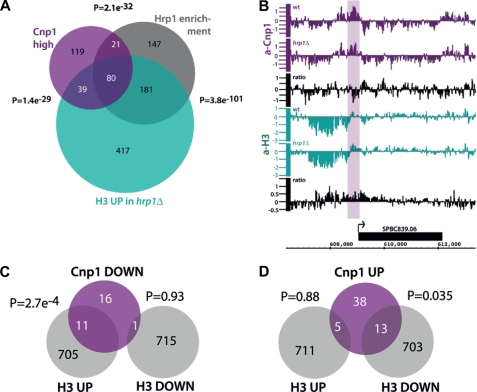
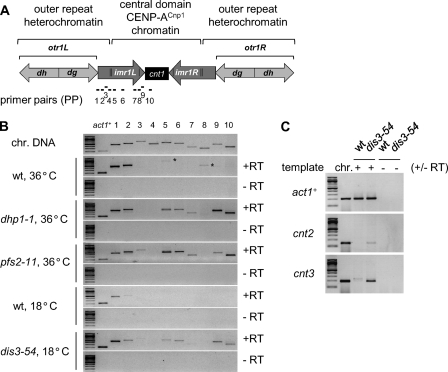
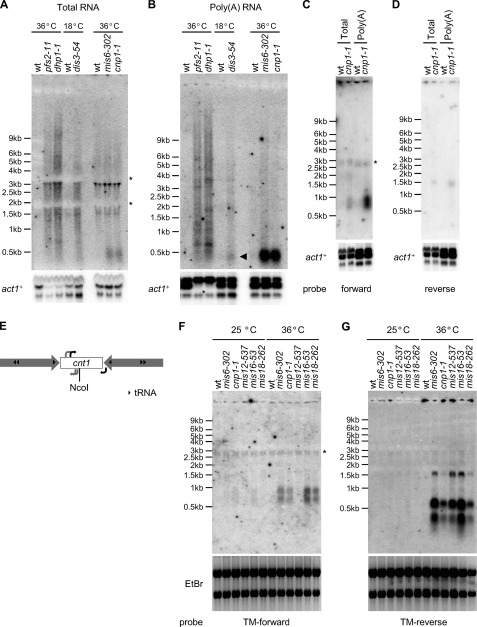
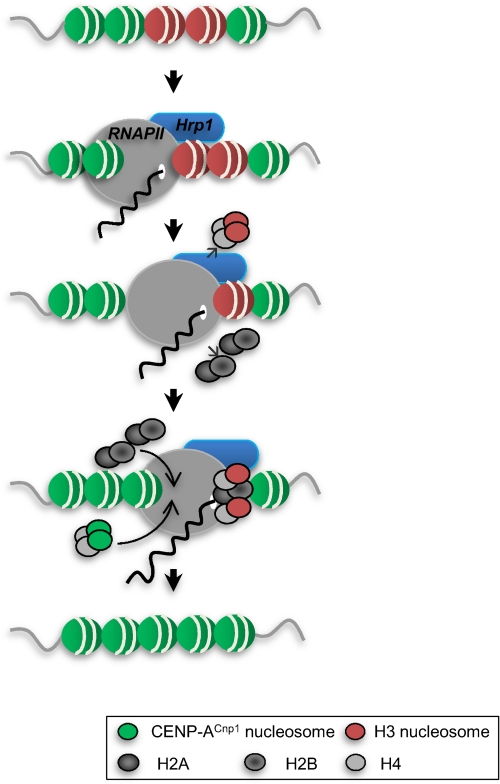
The histone H3 variant CENP-A is the most favored candidate for an epigenetic mark that specifies the centromere. In fission yeast, adjacent heterochromatin can direct CENP-A(Cnp1) chromatin establishment, but the underlying features governing where CENP-A(Cnp1) chromatin assembles are unknown. We show that, in addition to centromeric regions, a low level of CENP-A(Cnp1) associates with gene promoters where histone H3 is depleted by the activity of the Hrp1(Chd1) chromatin-remodeling factor. Moreover, we demonstrate that noncoding RNAs are transcribed by RNA polymerase II (RNAPII) from CENP-A(Cnp1) chromatin at centromeres. These analyses reveal a similarity between centromeres and a subset of RNAPII genes and suggest a role for remodeling at RNAPII promoters within centromeres that influences the replacement of histone H3 with CENP-A(Cnp1).
Figures
Similar articles
-
Mediator promotes CENP-a incorporation at fission yeast centromeres.Mol Cell Biol. 2012 Oct;32(19):4035-43. doi: 10.1128/MCB.00374-12. Epub 2012 Jul 30. Mol Cell Biol. 2012. PMID: 22851695 Free PMC article.
-
Factors that promote H3 chromatin integrity during transcription prevent promiscuous deposition of CENP-A(Cnp1) in fission yeast.PLoS Genet. 2012 Sep;8(9):e1002985. doi: 10.1371/journal.pgen.1002985. Epub 2012 Sep 20. PLoS Genet. 2012. PMID: 23028377 Free PMC article.
-
The Ino80 complex mediates epigenetic centromere propagation via active removal of histone H3.Nat Commun. 2017 Sep 13;8(1):529. doi: 10.1038/s41467-017-00704-3. Nat Commun. 2017. PMID: 28904333 Free PMC article.
-
Heterochromatin tells CENP-A where to go.Bioessays. 2008 Jun;30(6):526-9. doi: 10.1002/bies.20763. Bioessays. 2008. PMID: 18478529 Review.
-
Epigenetic Regulation of Chromatin States in Schizosaccharomyces pombe.Cold Spring Harb Perspect Biol. 2015 Jul 1;7(7):a018770. doi: 10.1101/cshperspect.a018770. Cold Spring Harb Perspect Biol. 2015. PMID: 26134317 Free PMC article. Review.
Cited by
-
Plasticity and epigenetic inheritance of centromere-specific histone H3 (CENP-A)-containing nucleosome positioning in the fission yeast.J Biol Chem. 2013 Jun 28;288(26):19184-96. doi: 10.1074/jbc.M113.471276. Epub 2013 May 9. J Biol Chem. 2013. PMID: 23661703 Free PMC article.
-
Five pillars of centromeric chromatin in fungal pathogens.PLoS Pathog. 2018 Aug 23;14(8):e1007150. doi: 10.1371/journal.ppat.1007150. eCollection 2018 Aug. PLoS Pathog. 2018. PMID: 30138484 Free PMC article. Review. No abstract available.
-
The minimal deneddylase core of the COP9 signalosome excludes the Csn6 MPN- domain.PLoS One. 2012;7(8):e43980. doi: 10.1371/journal.pone.0043980. Epub 2012 Aug 30. PLoS One. 2012. PMID: 22956996 Free PMC article.
-
Mediator promotes CENP-a incorporation at fission yeast centromeres.Mol Cell Biol. 2012 Oct;32(19):4035-43. doi: 10.1128/MCB.00374-12. Epub 2012 Jul 30. Mol Cell Biol. 2012. PMID: 22851695 Free PMC article.
-
CHD1 remodelers regulate nucleosome spacing in vitro and align nucleosomal arrays over gene coding regions in S. pombe.EMBO J. 2012 Nov 28;31(23):4388-403. doi: 10.1038/emboj.2012.289. Epub 2012 Oct 26. EMBO J. 2012. PMID: 23103765 Free PMC article.
References
Publication types
MeSH terms
Substances
Grants and funding
LinkOut - more resources
Full Text Sources
