

Active site-labeled prothrombin inhibits prothrombinase in vitro and thrombosis in vivo
- PMID: 21531712
- PMCID: PMC3123099
- DOI: 10.1074/jbc.M111.230292
Active site-labeled prothrombin inhibits prothrombinase in vitro and thrombosis in vivo
Abstract
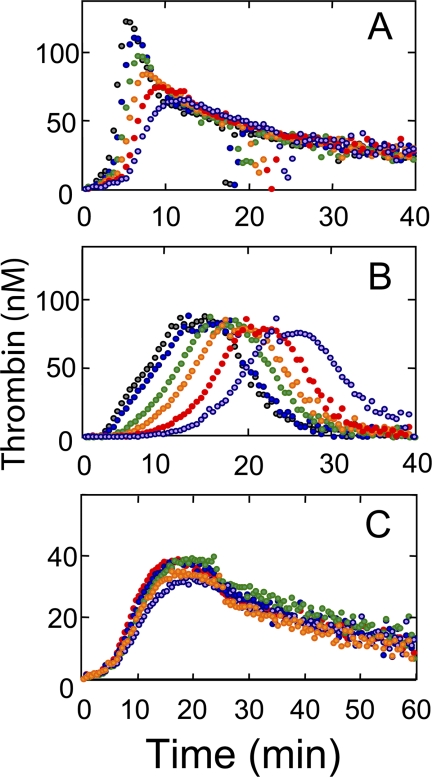
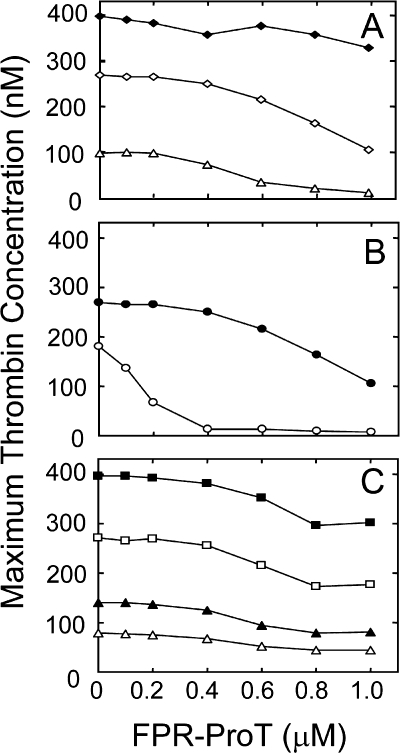
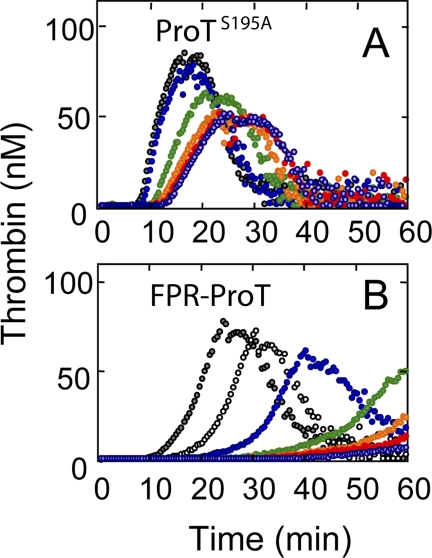
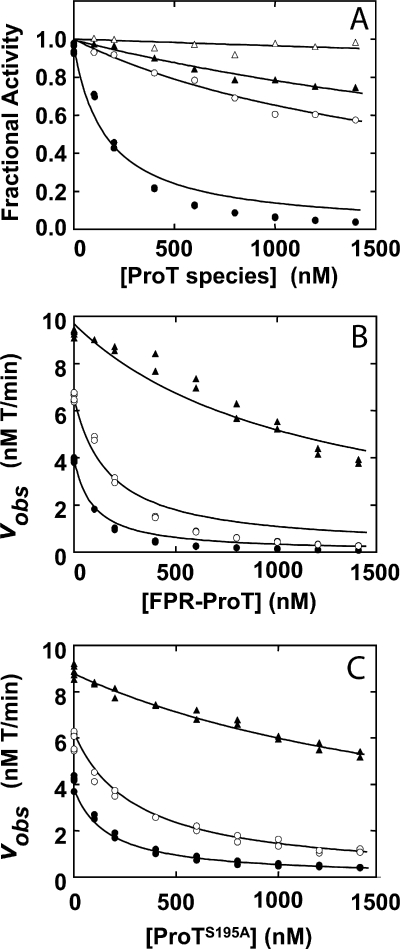
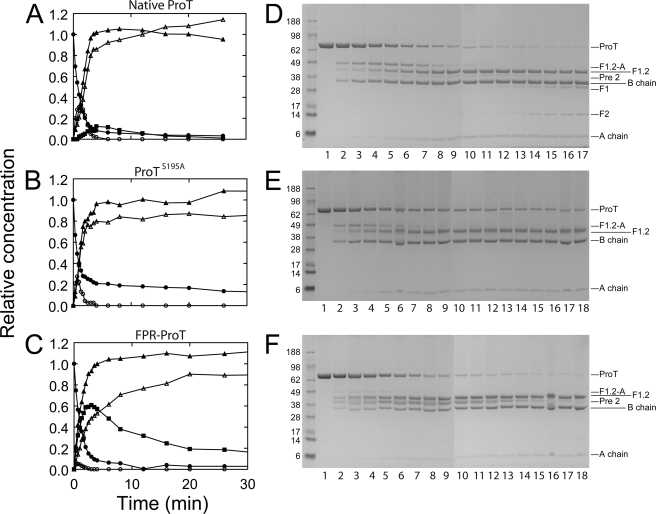
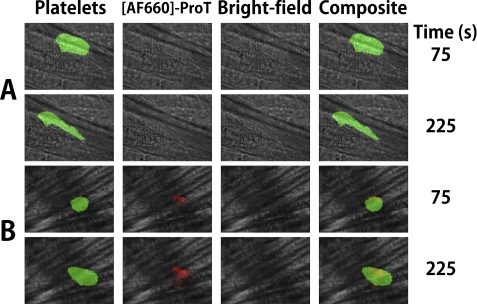
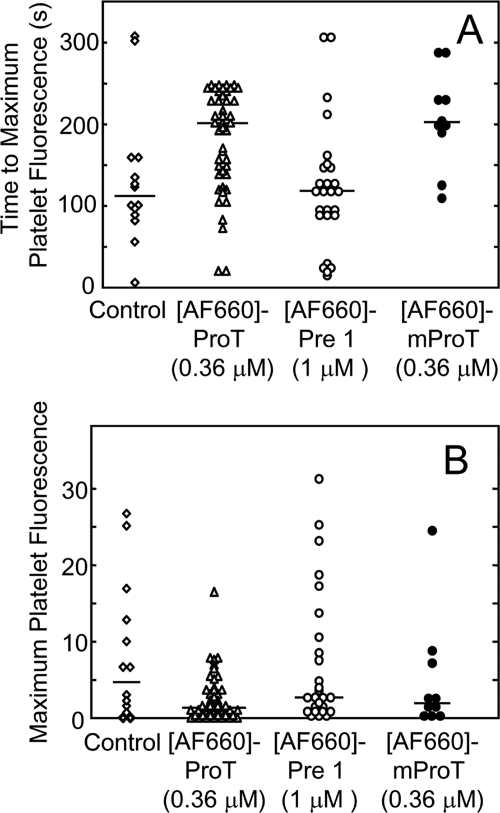
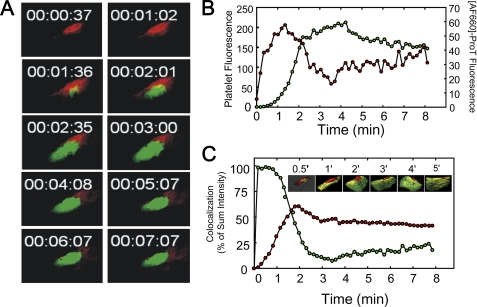
Mouse and human prothrombin (ProT) active site specifically labeled with D-Phe-Pro-Arg-CH(2)Cl (FPR-ProT) inhibited tissue factor-initiated thrombin generation in platelet-rich and platelet-poor mouse and human plasmas. FPR-prethrombin 1 (Pre 1), fragment 1 (F1), fragment 1.2 (F1.2), and FPR-thrombin produced no significant inhibition, demonstrating the requirement for all three ProT domains. Kinetics of inhibition of ProT activation by the inactive ProT(S195A) mutant were compatible with competitive inhibition as an alternate nonproductive substrate, although FPR-ProT deviated from this mechanism, implicating a more complex process. FPR-ProT exhibited ∼10-fold more potent anticoagulant activity compared with ProT(S195A) as a result of conformational changes in the ProT catalytic domain that induce a more proteinase-like conformation upon FPR labeling. Unlike ProT and ProT(S195A), the pathway of FPR-ProT cleavage by prothrombinase was redirected from meizothrombin toward formation of the FPR-prethrombin 2 (Pre 2)·F1.2 inhibitory intermediate. Localization of ProT labeled with Alexa Fluor® 660 tethered through FPR-CH(2)Cl ([AF660]FPR-ProT) during laser-induced thrombus formation in vivo in murine arterioles was examined in real time wide-field and confocal fluorescence microscopy. [AF660]FPR-ProT bound rapidly to the vessel wall at the site of injury, preceding platelet accumulation, and subsequently to the thrombus proximal, but not distal, to the vessel wall. [AF660]FPR-ProT inhibited thrombus growth, whereas [AF660]FPR-Pre 1, lacking the F1 membrane-binding domain did not bind or inhibit. Labeled F1.2 localized similarly to [AF660]FPR-ProT, indicating binding to phosphatidylserine-rich membranes, but did not inhibit thrombosis. The studies provide new insight into the mechanism of ProT activation in vivo and in vitro, and the properties of a unique exosite-directed prothrombinase inhibitor.
Figures
Similar articles
-
Expression of allosteric linkage between the sodium ion binding site and exosite I of thrombin during prothrombin activation.J Biol Chem. 2007 Jun 1;282(22):16095-104. doi: 10.1074/jbc.M610577200. Epub 2007 Apr 12. J Biol Chem. 2007. PMID: 17430903 Free PMC article.
-
The interaction of fragment 1 of prothrombin with the membrane surface is a prerequisite for optimum expression of factor Va cofactor activity within prothrombinase.Thromb Haemost. 2008 Mar;99(3):511-22. Thromb Haemost. 2008. PMID: 18327399
-
A control switch for prothrombinase: characterization of a hirudin-like pentapeptide from the COOH terminus of factor Va heavy chain that regulates the rate and pathway for prothrombin activation.J Biol Chem. 2006 Dec 22;281(51):39194-204. doi: 10.1074/jbc.M604482200. Epub 2006 Oct 4. J Biol Chem. 2006. PMID: 17020886
-
Alexa Fluor 680-NH-CO-CH2-S-CH2-Phe-Pro-Arg-CH2-prothrombin.2012 Mar 15 [updated 2012 May 15]. In: Molecular Imaging and Contrast Agent Database (MICAD) [Internet]. Bethesda (MD): National Center for Biotechnology Information (US); 2004–2013. 2012 Mar 15 [updated 2012 May 15]. In: Molecular Imaging and Contrast Agent Database (MICAD) [Internet]. Bethesda (MD): National Center for Biotechnology Information (US); 2004–2013. PMID: 22624172 Free Books & Documents. Review.
-
Coagulation factor V: a plethora of anticoagulant molecules.Curr Opin Hematol. 2005 Mar;12(2):141-8. doi: 10.1097/01.moh.0000155016.30296.90. Curr Opin Hematol. 2005. PMID: 15725905 Review.
Cited by
-
The endothelial protein C receptor enhances hemostasis of FVIIa administration in hemophilic mice in vivo.Blood. 2014 Aug 14;124(7):1157-65. doi: 10.1182/blood-2014-04-567297. Epub 2014 Jun 23. Blood. 2014. PMID: 24957146 Free PMC article.
-
How the Linker Connecting the Two Kringles Influences Activation and Conformational Plasticity of Prothrombin.J Biol Chem. 2016 Mar 18;291(12):6071-82. doi: 10.1074/jbc.M115.700401. Epub 2016 Jan 12. J Biol Chem. 2016. PMID: 26763231 Free PMC article.
-
Probing prothrombin structure by limited proteolysis.Sci Rep. 2019 Apr 16;9(1):6125. doi: 10.1038/s41598-019-42524-z. Sci Rep. 2019. PMID: 30992526 Free PMC article.
-
New insights into the spatiotemporal localization of prothrombinase in vivo.Blood. 2014 Sep 11;124(11):1705-14. doi: 10.1182/blood-2014-03-565010. Epub 2014 May 28. Blood. 2014. PMID: 24869936 Free PMC article.
-
Spatiotemporal regulation of coagulation and platelet activation during the hemostatic response in vivo.J Thromb Haemost. 2015 Nov;13(11):1949-59. doi: 10.1111/jth.13145. Epub 2015 Oct 23. J Thromb Haemost. 2015. PMID: 26386264 Free PMC article. Review.
References
-
- Krishnaswamy S. (2005) J. Thromb. Haemost. 3, 54–67 - PubMed
-
- Mann K. G., Nesheim M. E., Church W. R., Haley P., Krishnaswamy S. (1990) Blood 76, 1–16 - PubMed
-
- Rosing J., Tans G., Govers-Riemslag J. W., Zwaal R. F., Hemker H. C. (1980) J. Biol. Chem. 255, 274–283 - PubMed
-
- Krishnaswamy S., Betz A. (1997) Biochemistry 36, 12080–12086 - PubMed
-
- Boskovic D. S., Krishnaswamy S. (2000) J. Biol. Chem. 275, 38561–38570 - PubMed
Publication types
MeSH terms
Substances
Grants and funding
LinkOut - more resources
Full Text Sources
Other Literature Sources
Medical
