. 2011 Jun 24;286(25):22372-83.
doi: 10.1074/jbc.M111.233908. Epub 2011 Apr 29.

Formation of a stable RuvA protein double tetramer is required for efficient branch migration in vitro and for replication fork reversal in vivo

Affiliations

Formation of a stable RuvA protein double tetramer is required for efficient branch migration in vitro and for replication fork reversal in vivo

Alison S Bradley et al. J Biol Chem. .

Abstract

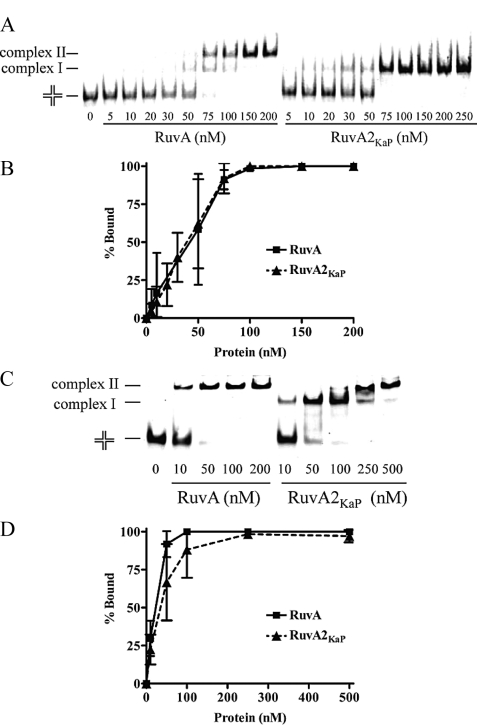
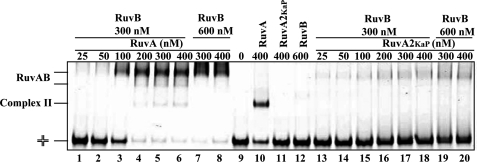
In bacteria, RuvABC is required for the resolution of Holliday junctions (HJ) made during homologous recombination. The RuvAB complex catalyzes HJ branch migration and replication fork reversal (RFR). During RFR, a stalled fork is reversed to form a HJ adjacent to a DNA double strand end, a reaction that requires RuvAB in certain Escherichia coli replication mutants. The exact structure of active RuvAB complexes remains elusive as it is still unknown whether one or two tetramers of RuvA support RuvB during branch migration and during RFR. We designed an E. coli RuvA mutant, RuvA2(KaP), specifically impaired for RuvA tetramer-tetramer interactions. As expected, the mutant protein is impaired for complex II (two tetramers) formation on HJs, although the binding efficiency of complex I (a single tetramer) is as wild type. We show that although RuvA complex II formation is required for efficient HJ branch migration in vitro, RuvA2(KaP) is fully active for homologous recombination in vivo. RuvA2(KaP) is also deficient at forming complex II on synthetic replication forks, and the binding affinity of RuvA2(KaP) for forks is decreased compared with wild type. Accordingly, RuvA2(KaP) is inefficient at processing forks in vitro and in vivo. These data indicate that RuvA2(KaP) is a separation-of-function mutant, capable of homologous recombination but impaired for RFR. RuvA2(KaP) is defective for stimulation of RuvB activity and stability of HJ·RuvA·RuvB tripartite complexes. This work demonstrates that the need for RuvA tetramer-tetramer interactions for full RuvAB activity in vitro causes specifically an RFR defect in vivo.


Figures

FIGURE 1.
FIGURE 1.
RuvA2KaP binding synthetic Holliday junction. A, representative EMSA is shown. Increasing concentrations of RuvA or RuvA2KaP were incubated with IRD700-labeled junction X12 in EDTA buffer and analyzed by native 4% PAGE. The expected positions of unbound HJ (cross schematic), complex I, and complex II are indicated. DNA was visualized by the Odyssey LI-COR fluoro imaging system. B, fluorescence scans of the resulting bands from six independent EMSAs were quantified and the data plotted as a graph of the percentage of X12 molecules bound by RuvA or RuvA2KaP as a function of protein concentration. The error bars are S.D. C, representative EMSA showing binding reactions with increasing concentrations of RuvA or RuvA2KaP incubated with IRD700-labeled X12 in Mg2+ buffer. Expected positions of unbound HJ, complex I, and complex II are indicated. The protein·DNA complexes were analyzed by native 4% PAGE in TBM buffer. D, five independent EMSAs of RuvA2KaP or RuvA with X12 in Mg2+ were quantified and the data plotted as a graph showing the percentage of X12 substrate bound by RuvA or RuvA2KaP as a function of protein concentration. The error bars are S.D.
FIGURE 2.
FIGURE 2.
Stability of complex II of RuvA mutants on Holliday junctions. A, increasing concentrations of RuvA mutants were incubated with X12; 100 nm RuvC was added, and the reaction was incubated for 15 min at 37 °C. The cleavage products were analyzed on native 4% PAGE, and a representative gel is shown. The positions of uncleaved HJ and cleavage product are indicated as schematics on the left. B, four independent experiments were quantified and the data used to plot a graph of the percentage of X12 substrate as a function of RuvA/RuvA mutant protein concentration. The error bars represent S.D.
FIGURE 3.
FIGURE 3.
ATP hydrolysis of RuvA mutant·RuvB complexes on synthetic HJs. A, time course of ATP hydrolysis. 100 nm RuvA or RuvA2KaP was incubated with 500 nm RuvB and X12 at 37 °C. ATP hydrolysis is proportional to the release of inorganic phosphate (in micromoles) as quantified using a colorimetric assay. Three separate data sets were quantified, and the data were plotted as the moles of ATP hydrolyzed per mol of RuvB as a function of time. The error bars represent S.D. B, ATPase activity at two different concentrations of RuvA or RuvA2KaP incubated with 500 nm RuvB and X12 for 30 min. The experiment and graph were produced as described in A. C, RuvA, RuvA2KaP, RuvAz3, or RuvAz87 were either incubated alone or mixed with 500 nm RuvB. These proteins were then incubated with ATP for 10 min at 37 °C in the presence of 200 ng·μl−1 φX174 virion DNA. ATP hydrolysis was indirectly measured using a colorimetric assay to detect the amount of Pi released. The data were used to plot a bar chart of moles of ATP hydrolyzed per min. The error bars represent S.D.
FIGURE 4.
FIGURE 4.
Interaction of RuvA2KaP with RuvB on HJ. Increasing amounts of RuvA or RuvA2KaP were mixed with X12 in the presence of 300 or 600 nm RuvB in triethanolamine buffer containing ATPγS. The protein·DNA complexes were cross-linked using 0.2% glutaraldehyde, and DNA·protein complexes were analyzed by native 6% PAGE. Unbound HJ (schematic), RuvA complex II formation, and RuvAB are indicated on the left.
FIGURE 5.
FIGURE 5.
Holliday junction processing of RuvA2KaP with RuvB. A, branch migration of X12. Increasing concentrations of RuvA and RuvA2KaP were incubated with 5 ng of IRD700-labeled X12 and 250 nm RuvB at 37 °C for 30 min. The reactions were stopped and analyzed by 6% native PAGE. A representative gel is shown, and the positions of unprocessed HJ are shown schematically on the left. B, three independent X12-HJ branch migration experiments were quantified, and the data were used to generate a graph showing the percentage of branch migration product formed as a function of protein concentration. The error bars represent S.D. C, branch migration of HJY3-hm. HJY3-hm was incubated with increasing concentrations of RuvA or RuvA2KaP and 250 nm RuvB at 37 °C for 30 min. Reactions were stopped and analyzed by native PAGE, and three independent branch migration experiments were quantified and plotted as a function of protein concentration. The error bars represent S.D.
FIGURE 6.
FIGURE 6.
RuvA2KaP binding to a synthetic fork in EDTA. A, increasing concentrations of RuvA or RuvA2KaP were incubated with fluorescently labeled F2 for 5 min on ice. Complexes of DNA with RuvA or RuvA2KaP were analyzed by native 4% PAGE. A schematic representation of the DNA substrate is shown, with the fluorescent-labeled oligonucleotide represented by an asterisk. B, six independent EMSAs were quantified, and the data were used to generate a graph showing the percentage of F2 substrate bound as a function of protein concentration. The error bars represent S.D. C, increasing concentrations of RuvA2KaP or RuvA were incubated with a synthetic model fork (F2) and 300 nm RuvB. The reactions were incubated for 30 min at 37 °C and analyzed by native 6% PAGE. Schematic representations of the substrate and the two possible branch migration products are indicated on the left. The 1st two lanes contain the two possible branch migration products as markers. D, six independent fork branch migration experiments were quantified, and the data were used to generate a graph of the percentage of product formed as a function of protein concentration. The error bars represent S.D.
FIGURE 7.
FIGURE 7.
RuvA2KaP complex II binding stability and RuvA2KaPB HJ and fork processing in vivo. A, C, and E, error bars represent S.D. B and D, error bars indicate the minimum and maximum values. A, RuvA2KaP was tested for rescue of conjugation ability of the E. coli strain JJC3207 (ruvA100 recG). RuvA2KaP was expressed from a pGB2 plasmid alone (pGB-ruvA2KaP) or in combination with RuvB (pGB-ruvA2KaPB). The log10 survival of conjugates/cfu was plotted as a bar graph. B, ability of RuvA2KaP to rescue UV sensitivity in a JJC2971 (ruvA100::cat) E. coli strain was tested. JJC291 was transformed with pGB2, pGB-ruvA, pGB-ruvA2KaP, or pGB-ruvA2KaPB. The ratio of colony-forming units of treated versus untreated cells was calculated to derive log10 survival ratio. C, JJC2971 cells were transformed with pGB2, pGB-ruvA, pGB-ruvA2KaP, and pGB-ruvA2KaPB and incubated with 2 μg·ml−1 of mitomycin C for 90 min. The ratio of colony-forming units of treated versus untreated cells was calculated to derive log10 survival ratio. D, RusA cleavage in vivo. JJC2761 (ΔruvABC rus-1) E. coli cells were transformed with pGB2, pGB-ruvA, pGB-ruvA2KaP, or pGB-ruvA2KaPB and exposed to UV radiation. The experiments were quantified, and the data were used to generate a graph of the log10 survival ratio of the transformants as a function of the dose of UV (J/m2). E, processing of synthetic forks by RuvA2KaP in vivo. An E. coli strain, JJC3723 (dnaEts recBCts ruvA100), was transformed with pGB2, pGB-ruvA, pGB-ruvA2KaP, or pGB-ruvA2KaPB. The cells were grown at 30 °C and then shifted to 42 °C for 3 h, after which fork reversal was assessed by the amount of double strand breaks generated, which was measured by the amount of linear chromosomal DNA entering a pulse field gel. The experiments were quantified and used to generate a histogram of the percentage of linear DNA for each strain.

Similar articles

Cited by

References

    1. Iwasaki H., Shiba T., Makino K., Nakata A., Shinagawa H. (1989) J. Bacteriol. 171, 5276–5280 - PMC - PubMed
    1. Tsaneva I. R., Müller B., West S. C. (1993) Proc. Natl. Acad. Sci. U.S.A. 90, 1315–1319 - PMC - PubMed
    1. Putnam C. D., Clancy S. B., Tsuruta H., Gonzalez S., Wetmur J. G., Tainer J. A. (2001) J. Mol. Biol. 311, 297–310 - PubMed
    1. Connolly B., Parsons C. A., Benson F. E., Dunderdale H. J., Sharples G. J., Lloyd R. G., West S. C. (1991) Proc. Natl. Acad. Sci. U.S.A. 88, 6063–6067 - PMC - PubMed
    1. Dunderdale H. J., Benson F. E., Parsons C. A., Sharples G. J., Lloyd R. G., West S. C. (1991) Nature 354, 506–510 - PubMed

Publication types

LinkOut - more resources