Fine mapping of a region of chromosome 11q13 reveals multiple independent loci associated with risk of prostate cancer
- PMID: 21531787
- PMCID: PMC3118760
- DOI: 10.1093/hmg/ddr189
Fine mapping of a region of chromosome 11q13 reveals multiple independent loci associated with risk of prostate cancer
Abstract
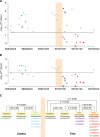
Genome-wide association studies have identified prostate cancer susceptibility alleles on chromosome 11q13. As part of the Cancer Genetic Markers of Susceptibility (CGEMS) Initiative, the region flanking the most significant marker, rs10896449, was fine mapped in 10 272 cases and 9123 controls of European origin (10 studies) using 120 common single nucleotide polymorphisms (SNPs) selected by a two-staged tagging strategy using HapMap SNPs. Single-locus analysis identified 18 SNPs below genome-wide significance (P< 10(-8)) with rs10896449 the most significant (P= 7.94 × 10(-19)). Multi-locus models that included significant SNPs sequentially identified a second association at rs12793759 [odds ratio (OR) = 1.14, P= 4.76 × 10(-5), adjusted P= 0.004] that is independent of rs10896449 and remained significant after adjustment for multiple testing within the region. rs10896438, a proxy of previously reported rs12418451 (r(2)= 0.96), independent of both rs10896449 and rs12793759 was detected (OR = 1.07, P= 5.92 × 10(-3), adjusted P= 0.054). Our observation of a recombination hotspot that separates rs10896438 from rs10896449 and rs12793759, and low linkage disequilibrium (rs10896449-rs12793759, r(2)= 0.17; rs10896449-rs10896438, r(2)= 0.10; rs12793759-rs10896438, r(2)= 0.12) corroborate our finding of three independent signals. By analysis of tagged SNPs across ∼123 kb using next generation sequencing of 63 controls of European origin, 1000 Genome and HapMap data, we observed multiple surrogates for the three independent signals marked by rs10896449 (n= 31), rs10896438 (n= 24) and rs12793759 (n= 8). Our results indicate that a complex architecture underlying the common variants contributing to prostate cancer risk at 11q13. We estimate that at least 63 common variants should be considered in future studies designed to investigate the biological basis of the multiple association signals.
Figures


Similar articles
-
Comprehensive resequence analysis of a 123-kb region of chromosome 11q13 associated with prostate cancer.Prostate. 2012 Apr;72(5):476-86. doi: 10.1002/pros.21450. Prostate. 2012. PMID: 22468268 Free PMC article.
-
Two independent prostate cancer risk-associated Loci at 11q13.Cancer Epidemiol Biomarkers Prev. 2009 Jun;18(6):1815-20. doi: 10.1158/1055-9965.EPI-08-0983. Cancer Epidemiol Biomarkers Prev. 2009. PMID: 19505914 Free PMC article.
-
Large-scale fine mapping of the HNF1B locus and prostate cancer risk.Hum Mol Genet. 2011 Aug 15;20(16):3322-9. doi: 10.1093/hmg/ddr213. Epub 2011 May 16. Hum Mol Genet. 2011. PMID: 21576123 Free PMC article.
-
Systematic enrichment analysis of potentially functional regions for 103 prostate cancer risk-associated loci.Prostate. 2015 Sep;75(12):1264-76. doi: 10.1002/pros.23008. Epub 2015 May 25. Prostate. 2015. PMID: 26015065 Review.
-
Reducing GWAS Complexity.Cell Cycle. 2016;15(1):22-4. doi: 10.1080/15384101.2015.1120928. Cell Cycle. 2016. PMID: 26771711 Free PMC article. Review.
Cited by
-
The genomic landscape of prostate cancer.Int J Mol Sci. 2013 May 24;14(6):10822-51. doi: 10.3390/ijms140610822. Int J Mol Sci. 2013. PMID: 23708091 Free PMC article. Review.
-
Current status of genome-wide association studies in cancer.Hum Genet. 2011 Jul;130(1):59-78. doi: 10.1007/s00439-011-1030-9. Epub 2011 Jun 16. Hum Genet. 2011. PMID: 21678065 Review.
-
Pancreatic Cancer Genetics.Int J Biol Sci. 2016 Jan 28;12(3):314-25. doi: 10.7150/ijbs.15001. eCollection 2016. Int J Biol Sci. 2016. PMID: 26929738 Free PMC article. Review.
-
Nuclear ARRB1 induces pseudohypoxia and cellular metabolism reprogramming in prostate cancer.EMBO J. 2014 Jun 17;33(12):1365-82. doi: 10.15252/embj.201386874. Epub 2014 May 16. EMBO J. 2014. PMID: 24837709 Free PMC article.
-
Epidemiology and Inherited Predisposition for Sporadic Pancreatic Adenocarcinoma.Hematol Oncol Clin North Am. 2015 Aug;29(4):619-40. doi: 10.1016/j.hoc.2015.04.009. Hematol Oncol Clin North Am. 2015. PMID: 26226901 Free PMC article. Review.
References
-
- Ferlay J., Autier P., Boniol M., Heanue M., Colombet M., Boyle P. Estimates of the cancer incidence and mortality in Europe in 2006. Ann. Oncol. 2007;18:581–592. - PubMed
-
- Jemal A., Siegel R., Ward E., Hao Y., Xu J., Thun M.J. Cancer statistics, 2009. CA. Cancer J. Clin. 2009;59:225–249. - PubMed
-
- Crawford E.D. Understanding the epidemiology, natural history, and key pathways involved in prostate cancer. Urology. 2009;73:S4–S10. - PubMed
-
- Lichtenstein P., Holm N.V., Verkasalo P.K., Iliadou A., Kaprio J., Koskenvuo M., Pukkala E., Skytthe A., Hemminki K. Environmental and heritable factors in the causation of cancer—analyses of cohorts of twins from Sweden, Denmark, and Finland. N. Engl. J. Med. 2000;343:78–85. - PubMed
-
- Al Olama A.A., Kote-Jarai Z., Giles G.G., Guy M., Morrison J., Severi G., Leongamornlert D.A., Tymrakiewicz M., Jhavar S., Saunders E., et al. Multiple loci on 8q24 associated with prostate cancer susceptibility. Nat. Genet. 2009;41:1058–1060. - PubMed
Publication types
MeSH terms
Grants and funding
LinkOut - more resources
Full Text Sources
Medical
Research Materials

