

Fine-mapping of colorectal cancer susceptibility loci at 8q23.3, 16q22.1 and 19q13.11: refinement of association signals and use of in silico analysis to suggest functional variation and unexpected candidate target genes
- PMID: 21531788
- PMCID: PMC3118761
- DOI: 10.1093/hmg/ddr190
Fine-mapping of colorectal cancer susceptibility loci at 8q23.3, 16q22.1 and 19q13.11: refinement of association signals and use of in silico analysis to suggest functional variation and unexpected candidate target genes
Abstract
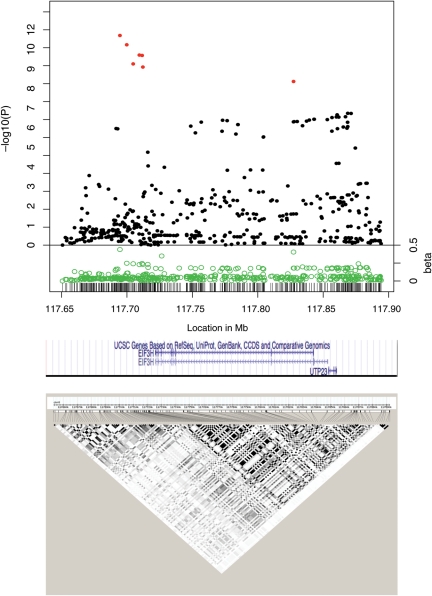
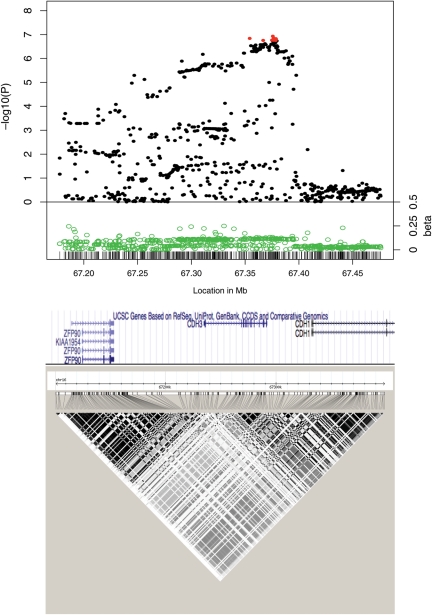
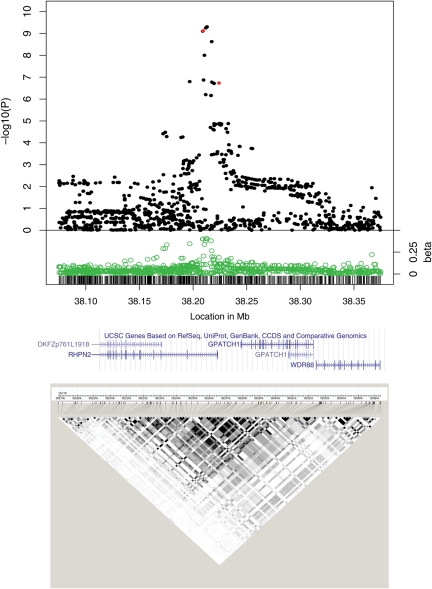
We have previously identified several colorectal cancer (CRC)-associated polymorphisms using genome-wide association (GWA) analysis. We sought to fine-map the location of the functional variants for three of these regions at 8q23.3 (EIF3H), 16q22.1 (CDH1/CDH3) and 19q13.11 (RHPN2). We genotyped two case-control sets at high density in the selected regions and used existing data from four other case-control sets, comprising a total of 9328 CRC cases and 10 480 controls. To improve marker density, we imputed genotypes from the 1000 Genomes Project and Hapmap3 data sets. All three regions contained smaller areas in which a cluster of single nucleotide polymorphisms (SNPs) showed clearly stronger association signals than surrounding SNPs, allowing us to assign those areas as the most likely location of the disease-associated functional variant. Further fine-mapping within those areas was generally unhelpful in identifying the functional variation based on strengths of association. However, functional annotation suggested a relatively small number of functional SNPs, including some with potential regulatory function at 8q23.3 and 16q22.1 and a non-synonymous SNP in RPHN2. Interestingly, the expression quantitative trait locus browser showed a number of highly associated SNP alleles correlated with mRNA expression levels not of EIF3H and CDH1 or CDH3, but of UTP23 and ZFP90, respectively. In contrast, none of the top SNPs within these regions was associated with transcript levels at EIF3H, CDH1 or CDH3. Our post-GWA study highlights benefits of fine-mapping of common disease variants in combination with publicly available data sets. In addition, caution should be exercised when assigning functionality to candidate genes in regions discovered through GWA analysis.
Figures
References
-
- Tomlinson I., Webb E., Carvajal-Carmona L., Broderick P., Kemp Z., Spain S., Penegar S., Chandler I., Gorman M., Wood W., et al. A genome-wide association scan of tag SNPs identifies a susceptibility variant for colorectal cancer at 8q24.21. Nat. Genet. 2007;39:984–988. doi:10.1038/ng2085. - DOI - PubMed
-
- Broderick P., Carvajal-Carmona L., Pittman A.M., Webb E., Howarth K., Rowan A., Lubbe S., Spain S., Sullivan K., Fielding S., et al. A genome-wide association study shows that common alleles of SMAD7 influence colorectal cancer risk. Nat. Genet. 2007;39:1315–1317. doi:10.1038/ng.2007.18. - DOI - PubMed
-
- Jaeger E., Webb E., Howarth K., Carvajal-Carmona L., Rowan A., Broderick P., Walther A., Spain S., Pittman A., Kemp Z., et al. Common genetic variants at the CRAC1 (HMPS) locus on chromosome 15q13.3 influence colorectal cancer risk. Nat. Genet. 2008;40:26–28. doi:10.1038/ng.2007.41. - DOI - PubMed
-
- Tomlinson I.P., Webb E., Carvajal-Carmona L., Broderick P., Howarth K., Pittman A.M., Spain S., Lubbe S., Walther A., Sullivan K., et al. A genome-wide association study identifies colorectal cancer susceptibility loci on chromosomes 10p14 and 8q23.3. Nat. Genet. 2008;40:623–630. doi:10.1038/ng.111. - DOI - PubMed
-
- Pittman A.M., Webb E., Carvajal-Carmona L., Howarth K., Di Bernardo M.C., Broderick P., Spain S., Walther A., Price A., Sullivan K., et al. Refinement of the basis and impact of common 11q23.1 variation to the risk of developing colorectal cancer. Hum. Mol. Genet. 2008;17:3720–3727. doi:10.1093/hmg/ddn267. - DOI - PubMed
Publication types
MeSH terms
Grants and funding
- G0000657-53203/MRC_/Medical Research Council/United Kingdom
- K/OPR/2/2/D333/CSO_/Chief Scientist Office/United Kingdom
- U01 CA074799/CA/NCI NIH HHS/United States
- 075491/Z/04/WT_/Wellcome Trust/United Kingdom
- 12076/CRUK_/Cancer Research UK/United Kingdom
- UO1 CA074799/CA/NCI NIH HHS/United States
- MR/K001744/1/MRC_/Medical Research Council/United Kingdom
- UO1 CA074806/CA/NCI NIH HHS/United States
- 090532/WT_/Wellcome Trust/United Kingdom
- U01 CA097735/CA/NCI NIH HHS/United States
- CA-95011/CA/NCI NIH HHS/United States
- UO1 CA074794/CA/NCI NIH HHS/United States
- U01 CA074783/CA/NCI NIH HHS/United States
- U01 CA074806/CA/NCI NIH HHS/United States
- UO1 CA074783/CA/NCI NIH HHS/United States
- MC_U127527198/MRC_/Medical Research Council/United Kingdom
- U01 CA074794/CA/NCI NIH HHS/United States
- CZB/4/449/CSO_/Chief Scientist Office/United Kingdom
- U01 CA074800/CA/NCI NIH HHS/United States
LinkOut - more resources
Full Text Sources
Other Literature Sources
Medical
Miscellaneous
