

Genome reduction by deletion of paralogs in the marine cyanobacterium Prochlorococcus
- PMID: 21531921
- PMCID: PMC3203624
- DOI: 10.1093/molbev/msr081
Genome reduction by deletion of paralogs in the marine cyanobacterium Prochlorococcus
Abstract
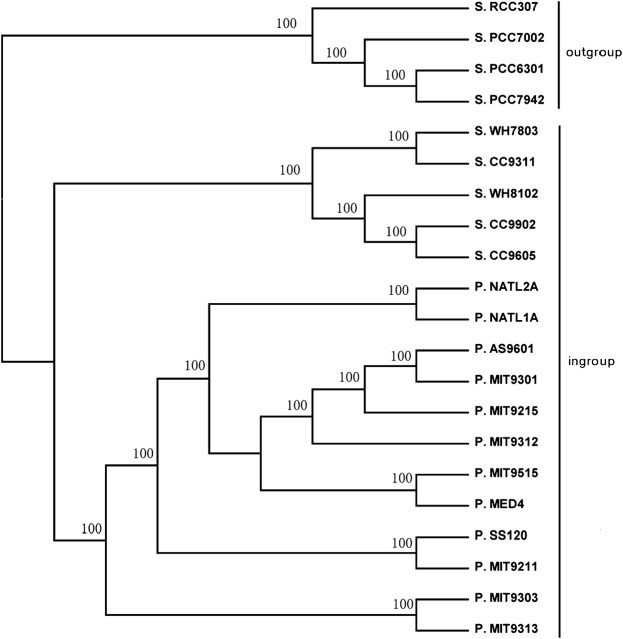
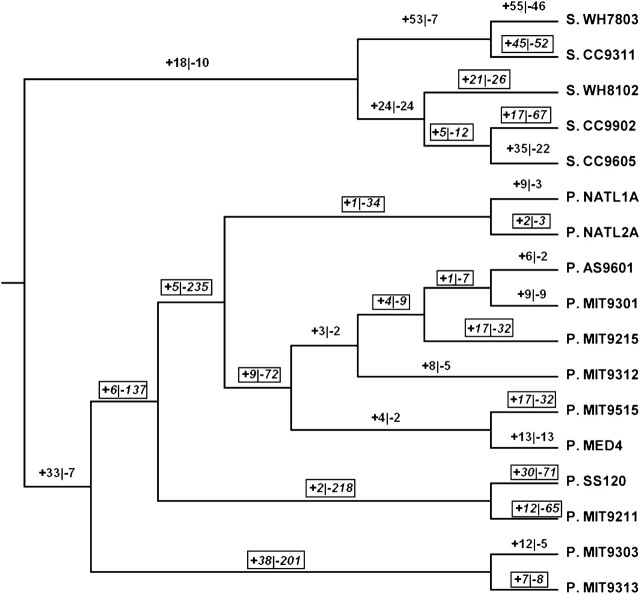
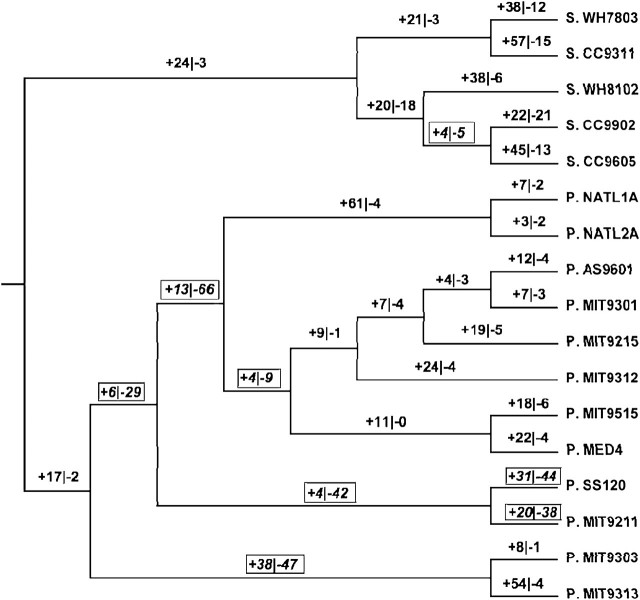
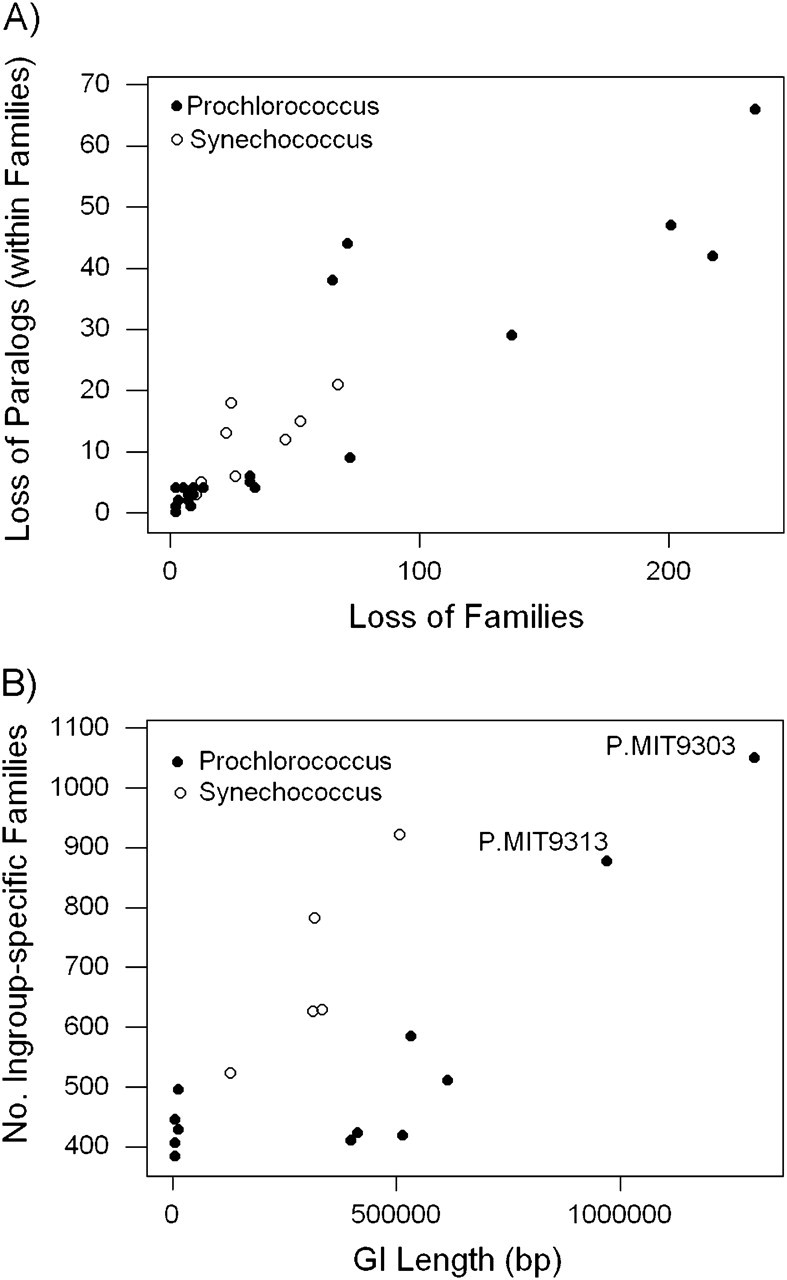
Several isolates of the marine cyanobacterial genus Prochlorococcus have smaller genome sizes than those of the closely related genus Synechococcus. In order to test whether loss of protein-coding genes has contributed to genome size reduction in Prochlorococcus, we reconstructed events of gene family evolution over a strongly supported phylogeny of 12 Prochlorococcus genomes and 9 Synechococcus genomes. Significantly, more events both of loss of paralogs within gene families and of loss of entire gene families occurred in Prochlorococcus than in Synechococcus. The number of nonancestral gene families in genomes of both genera was positively correlated with the extent of genomic islands (GIs), consistent with the hypothesis that horizontal gene transfer (HGT) is associated with GIs. However, even when only isolates with comparable extents of GIs were compared, significantly more events of gene family loss and of paralog loss were seen in Prochlorococcus than in Synechococcus, implying that HGT is not the primary reason for the genome size difference between the two genera.
Figures
References
-
- Chen X, Zheng J, Fu Z, Nan P, Zhong Y, Lonardi S, Jiang T. Assignment of orthologous genes via genome rearrangement. IEEE/ACM Trans Comput Biol Bioinform. 2005;2:302–315. - PubMed
-
- Coleman ML, Sullivan MB, Martiny AC, Steglich C, Barry K, DeLong EF, Chisholm SW. Genomic islands and the ecology and evolution of Prochlorococcus. Science. 2006;311:1768–1770. - PubMed
Publication types
MeSH terms
Grants and funding
LinkOut - more resources
Full Text Sources
Molecular Biology Databases
